Pokémon Card Market Report — November 2026
Vintage Pokémon cards outpaced modern chase by 10.3 points over the past 30 days.
CardTrack's monthly read on the Pokémon card market, built from live blended values across 4,324 tracked cards. Movement is each card's change vs the previous month's close. Every price on this page is CardTrack's value on 1 November 2026, when this edition was built. A card's own page shows today's value, which moves with each new sale.
Breadth · how many cards moved, not how far the big ones did
| Cards | Move | In | Up | Flat | Down | |
|---|---|---|---|---|---|---|
| All cards | +0.5% | 4,248 | 46% | 19% | 35% | |
| Vintage (1999–2002) | +3.5% | 485 | 55% | 19% | 26% | |
| Classic (2003–2010) | +0.3% | 1,374 | 54% | 27% | 19% | |
| Modern (2011–2019) | +3.4% | 1,420 | 52% | 18% | 30% | |
| Current (2020–) | -6.4% | 969 | 20% | 11% | 69% |
Of the 4,248 cards in the index, 46% rose more than 1% over the month, 19% held within 1% and 35% fell more than 1%. The index weights each card by its value, so a few expensive cards can carry it while most cards sit still; the two read together say which kind of period it was. An era is the card's set's release year.
The market, in plain English
Not a lot happened this month, and that's worth saying plainly: the CardTrack Index crept up just 0.5% over the past 30 days across the 4,324 liquid cards we track for Pokémon prices. That's the kind of number that barely registers against the noise of day-to-day sales — a quiet month by any measure, and after a few edges where things have been livelier, a bit of calm isn't a bad thing.
Stack that against other assets over the same stretch and Pokémon basically matched gold, which also moved 0.5%. Bitcoin ticked up 0.4%, so the index outpaced it by a hair. The S&P 500 was the standout, up 1.8% — meaningfully ahead of all three. Worth repeating: these are just price moves sitting side by side, no dividends, no fees, no spreads baked in, so it's a comparison of lines on a chart rather than what anyone would have actually pocketed. Still, it tells you cardboard wasn't doing anything unusual relative to the rest of the world this month — just drifting along with gold.
The index number hides some real fireworks underneath, though, because individual cards had a wild month even while the basket as a whole sat still. Victini-EX jumped 88.7% to $225, and right behind it Sableye climbed 88.6% to $75. The big-dollar mover was Salamence ex, up 88.5% and now sitting at $600 — one to watch if you're browsing the most valuable Pokémon cards. On the other side, Raichu from Next Destinies had a rough stretch, down 68% to $38, with Heat Rotom and a McDonald's-era Totodile also sliding hard. These are the kind of outsized, individual swings that get smoothed out of the index entirely — a reminder that "the basket is flat" and "nothing is happening to any single card" are two very different statements.
If you want to see where the real action is hiding card by card rather than in the aggregate, the CardTrack 100 is the place to poke around. December tends to bring its own rhythms as holiday buying picks up — we'll see if that nudges things awake.
📈 Top 10 risers
| # | Card | Value | 30d |
|---|---|---|---|
| 1 |  Victini-EXPlasma Storm #131 · Rare Ultra | $225📍 Last sold $173 PSA 7 · 8 Aug · 4 sales/90d | +88.7% |
| 2 | 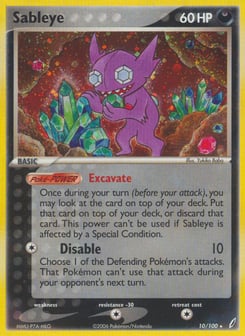 SableyeCrystal Guardians #10 · Rare Holo | $75PSA 10 $6,600📍 Last sold $15 Raw · 24 Jun | +88.6% |
| 3 | 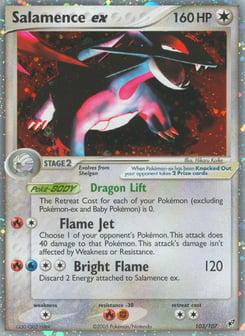 Salamence exDeoxys #103 · Rare Holo EX | $600PSA 10 $16,500📍 Last sold $110 Raw · 30 Aug · 12 sales/90d | +88.5% |
| 4 | 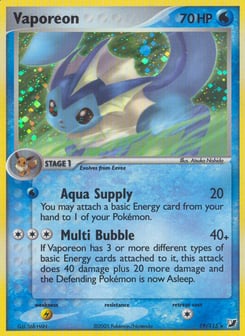 VaporeonUnseen Forces #19 · Rare Holo | $150PSA 10 $3,720 | +88.1% |
| 5 | 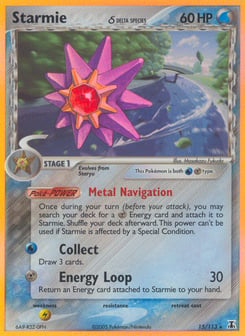 Starmie δDelta Species #15 · Rare Holo | $36PSA 10 $2,880📍 Last sold $41 PSA 1 · 26 Jul | +88.0% |
| 6 | 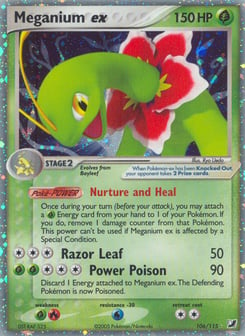 Meganium exUnseen Forces #106 · Rare Holo EX | $185PSA 10 $27,680📍 Last sold $219 PSA 8 · 25 Jun | +86.0% |
| 7 | 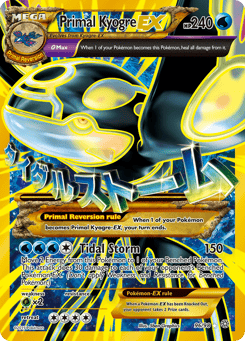 Primal Kyogre-EXAncient Origins #96 · Rare Secret | $525PSA 10 $6,390📍 Last sold $220 Raw · 27 Jun | +85.9% |
| 8 | 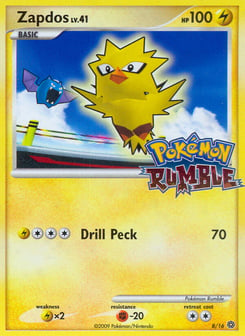 ZapdosPokémon Rumble #8 | $400PSA 10 $1,525 | +85.4% |
| 9 | 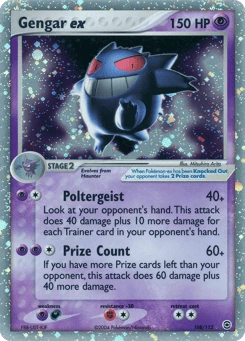 Gengar exFireRed & LeafGreen #108 · Rare Holo EX | $2,500PSA 10 $108,000📍 Last sold $467 Raw · 30 Aug · 12 sales/90d | +85.4% |
| 10 | 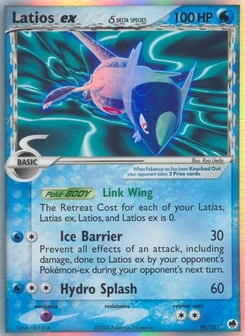 Latios ex δDragon Frontiers #96 · Rare Holo EX | $480PSA 10 $9,600📍 Last sold $190 Raw · 30 Aug · 12 sales/90d | +85.0% |
📉 Top 10 fallers
| # | Card | Value | 30d |
|---|---|---|---|
| 1 | 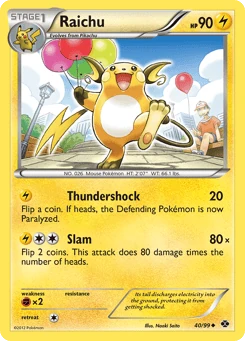 RaichuNext Destinies #40 · Uncommon | $38 | -68.0% |
| 2 | 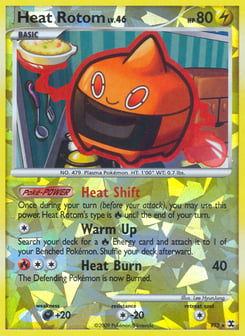 Heat RotomRising Rivals #RT3 · Rare | $42PSA 10 $561 | -66.7% |
| 3 | 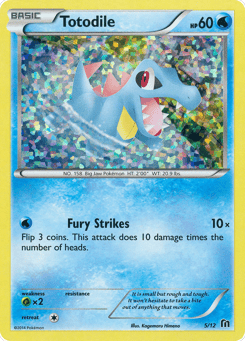 TotodileMcDonald's Collection 2016 #5 | $37 | -62.5% |
| 4 | 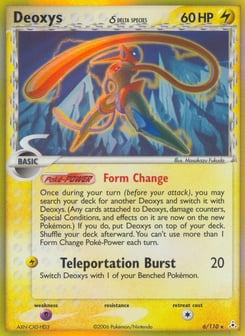 Deoxys δHolon Phantoms #6 · Rare Holo | $92PSA 10 $8,320📍 Last sold $473 PSA 9 · 25 Jun | -58.0% |
| 5 |  Champions FestivalBW Black Star Promos #BW95 · Promo | $81 | -52.4% |
| 6 | $35PSA 10 $700📍 Last sold $13 Raw · 27 Jun | -50.0% | |
| 7 | 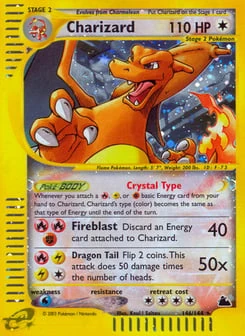 CharizardSkyridge #146 · Rare Secret | $9,864PSA 10 $160,430📍 Last sold $1,601 Raw · 29 Jun | -49.5% |
| 8 | 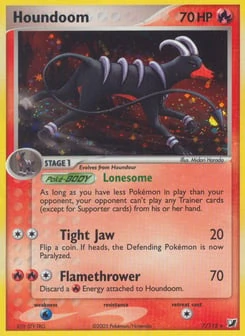 HoundoomUnseen Forces #7 · Rare Holo | $68PSA 10 $15,600📍 Last sold $250 PSA 9 · 15 Jun | -46.9% |
| 9 | 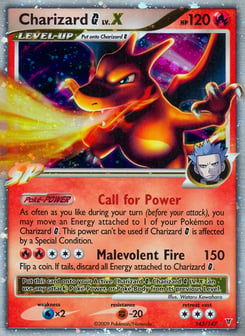 Charizard G LV.XSupreme Victors #143 · Rare Holo LV.X | $427PSA 10 $66,840📍 Last sold $200 Raw · 25 Jun | -46.6% |
| 10 | 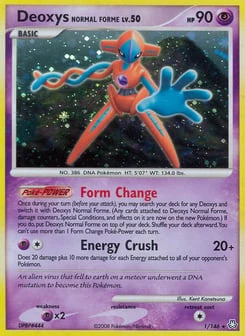 Deoxys Normal FormeLegends Awakened #1 · Rare Holo | $39 | -46.1% |
💵 Biggest dollar movers
| # | Card | Value | $ move | 30d |
|---|---|---|---|---|
| 1 | CharizardSkyridge #146 · Rare Secret | $9,864PSA 10 $160,430📍 Last sold $1,601 Raw · 29 Jun | −$9,668 | -49.5% |
| 2 | 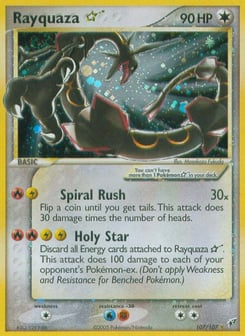 Rayquaza ☆Deoxys #107 · Rare Holo Star | $20,000PSA 10 $682,500📍 Last sold $18,050 PSA 5 · 26 Jul | −$7,894 | -28.3% |
| 3 | 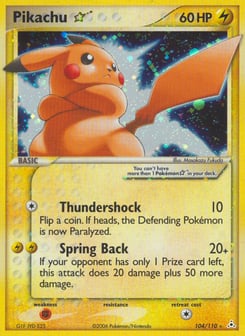 Pikachu ☆Holon Phantoms #104 · Rare Holo Star | $9,800PSA 10 $360,000📍 Last sold $4,699 CGC 4 · 30 Aug · 11 sales/90d | +$3,538 | +56.5% |
| 4 | 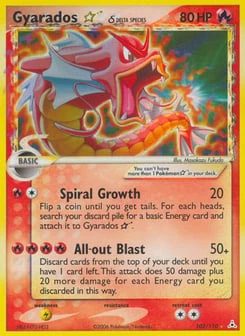 Gyarados ☆ δHolon Phantoms #102 · Rare Holo Star | $8,000PSA 10 $80,520📍 Last sold $2,300 Raw · 29 Aug · 12 sales/90d | +$1,610 | +25.2% |
| 5 | 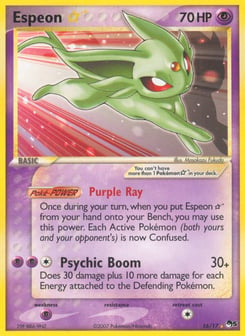 Espeon ☆POP Series 5 #16 · Rare | $8,842PSA 10 $360,000📍 Last sold $5,750 Raw · 28 Aug · 9 sales/90d | +$1,368 | +18.3% |
| 6 | Gengar exFireRed & LeafGreen #108 · Rare Holo EX | $2,500PSA 10 $108,000📍 Last sold $467 Raw · 30 Aug · 12 sales/90d | +$1,152 | +85.4% |
| 7 | 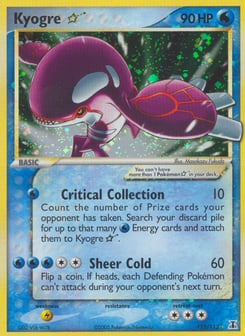 Kyogre ☆Delta Species #112 · Rare Holo Star | $2,716PSA 10 $156,000📍 Last sold $2,800 PSA 7 · 9 Aug · 5 sales/90d | +$743 | +37.7% |
| 8 | 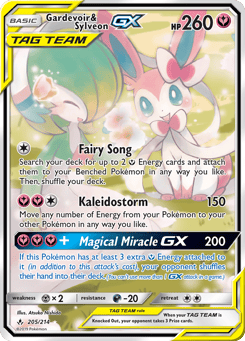 Gardevoir & Sylveon-GXUnbroken Bonds #205 · Rare Ultra | $968PSA 10 $3,380📍 Last sold $4,550 PSA 10 · 27 Jun | −$648 | -40.1% |
| 9 | 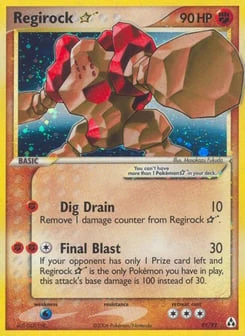 Regirock ☆Legend Maker #91 · Rare Holo Star | $1,800PSA 10 $122,339📍 Last sold $1,400 CGC 7.5 · 20 Jun | +$636 | +54.7% |
| 10 | 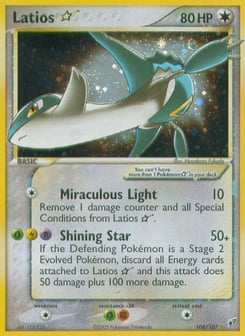 Latios ☆Deoxys #106 · Rare Holo Star | $3,998PSA 10 $32,800📍 Last sold $4,750 PSA 5 · 28 Aug · 12 sales/90d | +$627 | +18.6% |
🏆 PSA 10 premium leaders
Biggest raw → PSA 10 multipliers — where grading adds the most. See the full Grading ROI index →
| # | Card | Raw | PSA 10 | Premium |
|---|---|---|---|---|
| 1 | $25 | $1,000 | 40× | |
| 2 | $35 | $1,400 | 40× | |
| 3 | 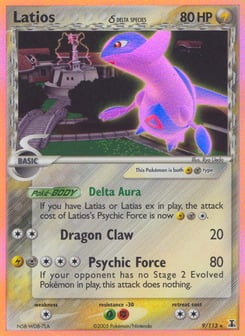 Latios δDelta Species #9📍 Last sold $3,999 PSA 10 · 9 Aug · 5 sales/90d | $175 | $7,000 | 39.9× |
| 4 | 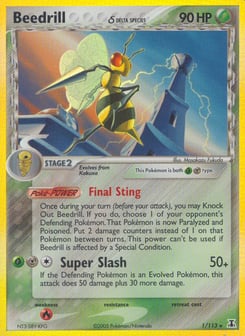 Beedrill δDelta Species #1 | $50 | $1,985 | 39.7× |
| 5 | 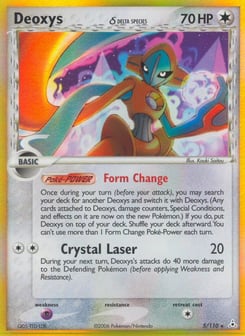 Deoxys δHolon Phantoms #5📍 Last sold $40 Raw · 30 Aug · 7 sales/90d | $250 | $9,900 | 39.6× |
| 6 | 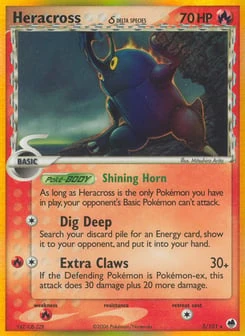 Heracross δDragon Frontiers #3📍 Last sold $19 Raw · 25 Jul | $38 | $1,500 | 39.5× |
| 7 | 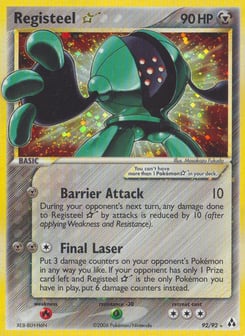 Registeel ☆Legend Maker #92📍 Last sold $752 Raw · 30 Aug · 12 sales/90d | $1,987 | $78,000 | 39.3× |
| 8 | $42 | $1,620 | 38.9× | |
| 9 | 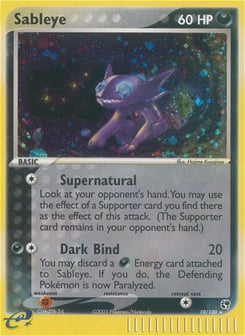 SableyeSandstorm #10📍 Last sold $80 Raw · 27 Jun | $182 | $7,100 | 38.9× |
| 10 | $180 | $7,000 | 38.9× |
💎 Grading ROI spotlight
Where grading pays off most — the PSA 10 best case beside the expected return once every grade is weighted by its gem rate, after cost. Full Grading ROI index →
| # | Card | Gem rate | Best case | Expected |
|---|---|---|---|---|
| 1 | 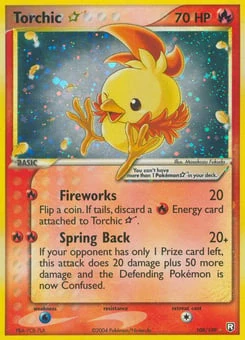 Torchic ☆Team Rocket Returns #108 | 1.2% | +$2,658,326 | +$162,042 |
| 2 | 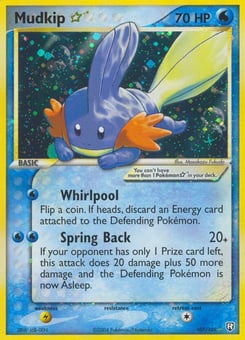 Mudkip ☆Team Rocket Returns #107 | 2.9% | +$1,023,519 | +$94,443 |
| 3 | 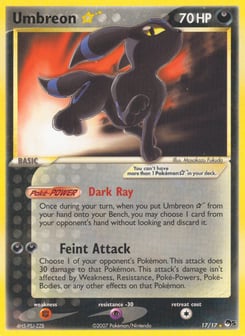 Umbreon ☆POP Series 5 #17 | 6.2% | +$438,983 | +$48,442 |
| 4 | 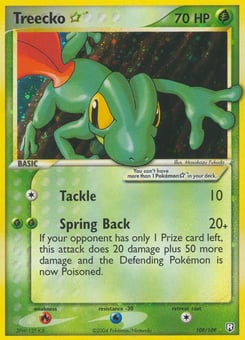 Treecko ☆Team Rocket Returns #109 | 3.7% | +$483,609 | +$47,265 |
| 5 | Espeon ☆POP Series 5 #16 | 6.7% | +$342,539 | +$39,358 |
| 6 | Rayquaza ☆Deoxys #107 | 2.4% | +$650,656 | +$35,275 |
| 7 | 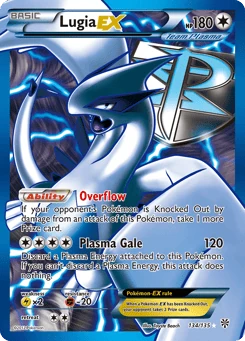 Lugia-EXPlasma Storm #134 | 1% | +$647,131 | +$31,752 |
| 8 | 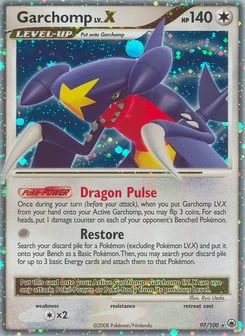 Garchomp LV.XMajestic Dawn #97 | 1.6% | +$441,206 | +$30,626 |
📦 Sealed product watch









Reading the November 2026 numbers
The CardTrack Index reads 111.0 this edition. That figure compares totals: the 4,324 cards in this basket are worth 11.0% more in total than the 4,363 cards in the October 2026 report's basket were. The +0.5% beside it is a different measure: the value-weighted average of each card's own move since that snapshot, leaving out any move beyond ±90%. The two disagree by 10.5 points this edition, because a card joins or leaves the basket as its value crosses the $10 floor, and a total over a different set of cards is not a like-for-like comparison.
Read the index as a measurement of CardTrack's own values, not as a market return. Both snapshots are blended prices, so when CardTrack changes how a price is computed, every card priced that way moves between editions without a copy changing hands. Even a reading as small as +0.5% belongs next to the movers above, not in a sentence about where the market went. The daily CardTrack 100 marks its own method steps, and the way a blended price is built is set out in how CardTrack prices cards.
Vintage here means cards from sets released before 2003 (492 cards this edition); modern chase means alt-art, illustration, special illustration, secret, rainbow, hyper and V-era ultra rarities (1,531 cards). Vintage led by 10.3 points, +3.5% against -6.8%. They moved in opposite directions, which is the case where the gap between them says the most. The vintage basket is the smaller of the two, so a handful of expensive cards carry more of its average.
Victini-EX from Plasma Storm tops the risers at +88.7%, now $225. All 10 risers moved 80% or more, close to the ±90% line beyond which a move is treated as bad data (63 cards crossed it this edition and were set aside). A move that near the cut-off deserves the same suspicion: open the card page and check the sales before reading it as demand. None of them is from a set released before 2003. The daily movers board shows the same kind of list updated every day rather than once a month.
At the other end, Raichu (Next Destinies) fell 68.0% to $38. One of the fallers is a Black Star promo; the rest come from booster sets. Percentages flatter cheap cards, so the dollar table ranks by the size of the move in money: Charizard (Skyridge) moved −$9,668 to $9,864. 7 of the biggest dollar moves were rises and 3 were falls.
The PSA 10 premium table divides a card's PSA 10 price by its raw price and only considers multiples between 2× and 40×, which is why this edition's leaders sit between 38.9× and 40×. Light Flareon (Neo Destiny) leads at 40×: $25 raw against $1,000 in a PSA 10. A big multiple says a gem copy is scarce next to raw ones; it says nothing about your chance of grading one, which is what the gem rate measures. The grading spotlight weighs that chance in. For Torchic ☆ (Team Rocket Returns) the best case after about $32,019 of grading and shipping cost is +$2,658,326, but only 1.2% of the copies in PSA's population report are 10s, so the expected result, valuing a PSA 9 at 40% of a PSA 10 and anything lower at the raw price, is +$162,042.
Rising Rivals Booster Pack leads the sealed table at +150.0%, priced at $1,000, while 30th Celebration Battle Deck [Umbreon ex] is the weakest at -56.4%. Sealed moves are each product's 30-day price change when the edition was built, not a month-over-month snapshot like the cards; current prices are on the sealed Pokémon products pages.
The basket went from 4,363 tracked cards in October 2026 to 4,324 in November 2026. This report samples one snapshot a month; to follow a single card between editions, open its card page, where the price history is daily. Every figure above is in the JSON download below under the same free-to-cite terms, and earlier editions are in the Pokémon market report archive.
Cite & embed this data
Free to use with attribution to CardTrack.
Pokémon Card Market Report — November 2026. CardTrack, 1 November 2026. https://cardtrack.com/pokemon/reports/pokemon-card-market-report-2026-11<iframe src="https://cardtrack.com/embed/cardtrack-index" width="100%" height="240" style="border:0;border-radius:12px" title="CardTrack Pokémon Index"></iframe>
<p style="font:12px sans-serif">Source: <a href="https://cardtrack.com/pokemon/reports/pokemon-card-market-report-2026-11">CardTrack Pokémon Card Market Report</a></p><iframe src="https://cardtrack.com/embed/report?id=2026-11" width="100%" height="300" style="border:0;border-radius:12px" title="CardTrack Pokémon market report — November 2026"></iframe>Frequently asked questions
What is the CardTrack Index?
The CardTrack Index tracks the value of a basket of 4,324 liquid Pokémon cards, with sub-indices for Vintage (pre-2003), Modern chase and Graded (PSA 10). This edition it stands at 111.0, +0.5% over the past 30d.
Why are some big movers excluded?
Movers need a minimum value (≥ $30) and at least three contributing marketplaces, and any move beyond ±90% is treated as bad data rather than a real price change — 63 cards were excluded and flagged for review this edition.
Is vintage or modern doing better right now?
This edition, Vintage (pre-2003) moved +3.5% and Modern chase moved -6.8% over the past 30d.
Is a rising CardTrack Index a reason to buy Pokémon cards?
No. The index compares two snapshots of CardTrack's blended values, so it moves when prices move and also when CardTrack changes how a price is computed; this edition's +0.5% is a reading of those values, not a forecast. It describes where CardTrack's prices sat when the edition was built, not where they are going, and nothing in this report is financial advice.
How is the PSA 10 premium calculated?
It is a card's PSA 10 price divided by its raw (ungraded) price, and the table only considers multiples from 2× to 40×. This edition Light Flareon (Neo Destiny) leads at 40×, $25 raw against $1,000 in a PSA 10. The multiple ignores grading cost and the odds of a 10, which the grading spotlight accounts for.
Methodology
The CardTrack Index tracks the value of a basket of liquid Pokémon cards, with sub-indices for Vintage (pre-2003), Modern chase (alt-arts, illustration/secret/rainbow rares) and Graded (PSA 10). Blended from eBay sold results, Fanatics auctions, TCGplayer and PriceCharting, updated daily. To avoid noise, movers need a minimum value (≥ $30) and at least three contributing marketplaces, and any move beyond ±90% is treated as bad data rather than a real price change and is excluded. This is market data, not financial advice — prices can move quickly.