The Pokémon card market, in one number.
The combined value of the 100 most valuable Pokémon cards — re-ranked every month and tracked as one index. It comes in two halves too: Vintage (sets from 1999–2010) and Modern (sets from 2011 onward), each its own top 100. Every card in the basket is listed below, with its live price and weight.
Fear & Greed · the market's mood on 15 Nov 2026, from five measures CardTrack publishes
Each part scores 0 (fear) to 100 (greed) on a rule fixed in advance and the reading is their average: the CT100 against its 90-day average (10% either way is the full scale); cards up as a share of cards that moved over 30 days; cards at a 12-month high as a share of those at a high or a low; the PSA 10 premium's place in its own 24-month range; and the share of the 100 most expensive cards whose last sale cleared their 24-month median. Breadth and highs read the same restated price series the card charts draw, so a method change never reads as a mood swing. A part without a reading is left out. History begins 29 Aug 2026; the top-end part joined on 23 October 2026. A measure of the market, not advice.
History back to 2021 is monthly, from PriceCharting sales; the recent detail is live near-mint market pricing. The CardTrack 100 re-ranks the basket every month and chain-links the return, so it reflects the actual top 100 Pokémon cards at each point in time — not today's basket projected backward.
The cap-weighted sibling · every graded slab weighted by how many exist, beside the top-100 index, both 100 = Jan 2022
| Window | Graded market cap index | CardTrack 100 | Gap (points) |
|---|---|---|---|
| 30 days | −1.6% | +2.0% | −3.6 pts |
| 90 days | +19.9% | +0.0% | +19.9 pts |
| 1 year | +118.5% | +47.3% | +71.2 pts |
| Since Jan 2022 | +105.6% | +171.6% | −66.0 pts |
The CardTrack 100 is deliberately top-heavy: the 100 most valuable cards, re-ranked every month and chain-linked, so it tells you what the grails did. The graded market cap index is the other reading of the same market: every English PSA 8, 9 and 10 slab CardTrack can price, each card weighted by how many slabs of it exist today, chain-linked step by step over the lines priced at both ends of the step, so a set entering the market never reads as a move and the weights never need a divisor. Monthly to 29 Aug 2026 from the same restated price series the card charts draw, daily since, both lines rebased to 100 on 1 Jan 2022. Its level and slab counts live on the market cap page; the CT100's own base (100 = Sep 2021) and splice are unchanged.
How the same money would've grown · the CardTrack 100 vs Bitcoin, gold & the S&P 500, Sep 2021 → Nov 2026
The 100 most valuable Pokémon cards aren't a fund you can buy — but if you could, here's how the same money would have done against Bitcoin, gold and the stock market Sep 2021 → Nov 2026.
CardTrack 100 = the basket's combined value; Vintage and Modern are each their own top 100, split by the card's set release year. Bitcoin = BTC-USD, Gold = front-month COMEX futures (GC=F), S&P 500 = the ^GSPC price index (dividends excluded), all monthly closes rebased to the same start date. Card history before 2026 is monthly PriceCharting data; market data via Yahoo Finance. Not investment advice.
Return and risk since Sep 2021 · annualised return, deepest fall and volatility, every asset over the same days
| Asset | Total return | Annualised | Max drawdown | Volatility (annualised) | $1,000 became (USD) |
|---|---|---|---|---|---|
| CardTrack 100 (Pokémon cards) | +148.9% | +19.1% | -27.0% | 14.6% | $2,489 |
| Goldto Oct 2026, its latest print | +139.4% | +18.7% | -15.8% | 16.0% | $2,394 |
| Bitcointo Oct 2026, its latest print | +91.6% | +13.7% | -73.0% | 54.3% | $1,916 |
| Nasdaq Compositeto Oct 2026, its latest print | +89.4% | +13.4% | -33.1% | 20.0% | $1,894 |
| S&P 500to Oct 2026, its latest print | +81.3% | +12.4% | -24.8% | 15.5% | $1,813 |
| US house pricesto Jul 2026, its latest print | +24.3% | +4.6% | -5.0% | 2.7% | $1,243 |
| US consumer prices (CPI)to Aug 2026, its latest print | +22.0% | +4.1% | -0.4% | 1.0% | $1,220 |
Volatility is the standard deviation of monthly changes, annualised; stock indices exclude dividends. Other windows (1, 3 and 5 years), the method and a downloadable chart: Pokémon cards vs Bitcoin, gold, stocks and inflation.
Biggest movers · recent price trend
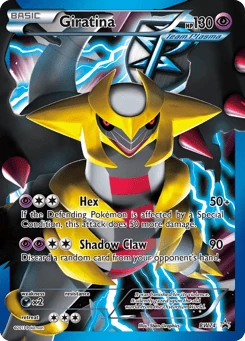
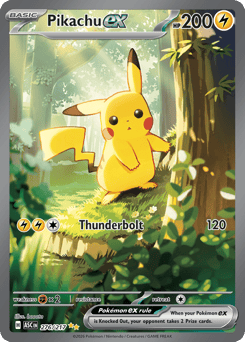
Charizard leads the gainers, up 148.0%. Pikachu is the biggest faller, down 33.3%. The index itself is up 2.0% over the last 30 days.
Biggest movers · CardTrack 100 Vintage, recent price trend
Charizard leads the gainers, up 148.0%. Pikachu is the biggest faller, down 33.3%. The index itself is up 2.7% over the last 30 days.
Biggest movers · CardTrack 100 Modern, recent price trend
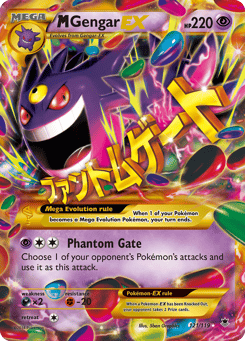
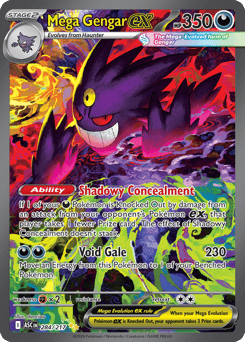
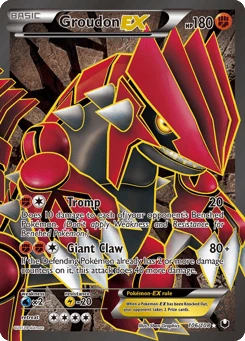
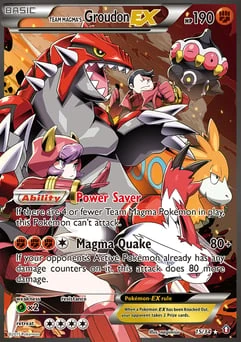
Groudon leads the gainers, up 93.6%. Mega Gengar ex is the biggest faller, down 28.9%. The index itself is up 0.4% over the last 30 days.
The 100 constituents
| # | Card | Price | Weight | Trend |
|---|---|---|---|---|
| 1 | 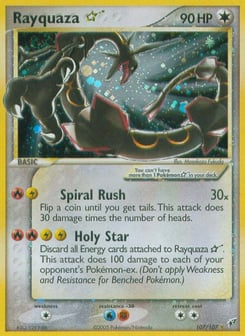 Rayquaza ☆Deoxys · #107 | $27,672 | 10.3% | +38.4% |
| 2 | 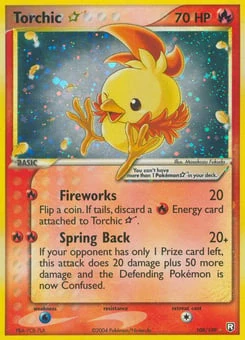 Torchic ☆Team Rocket Returns · #108 | $10,200 | 3.8% | -8.9% |
| 3 | 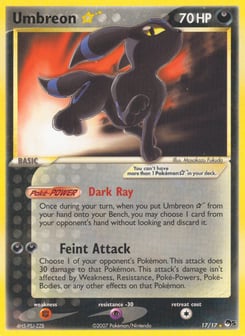 Umbreon ☆POP Series 5 · #17 | $9,999 | 3.7% | — |
| 4 | 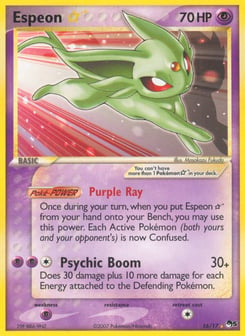 Espeon ☆POP Series 5 · #16 | $9,043 | 3.4% | +2.3% |
| 5 | 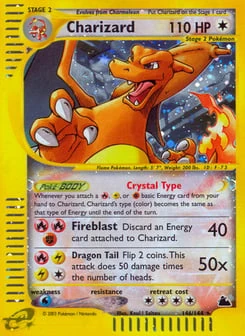 CharizardSkyridge · #146 | $8,899 | 3.3% | -3.6% |
| 6 | 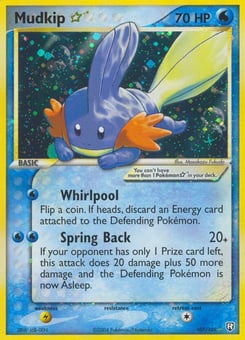 Mudkip ☆Team Rocket Returns · #107 | $7,250 | 2.7% | -3.3% |
| 7 | 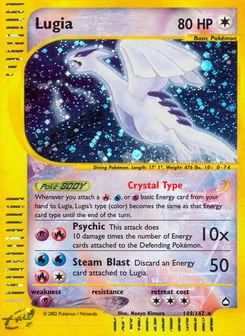 LugiaAquapolis · #149 | $7,100 | 2.6% | +5.8% |
| 8 | 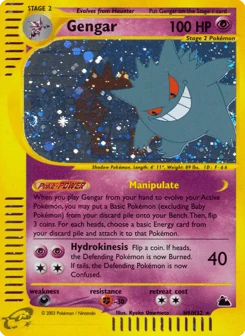 GengarSkyridge · #H9 | $6,500 | 2.4% | +3.0% |
| 9 | 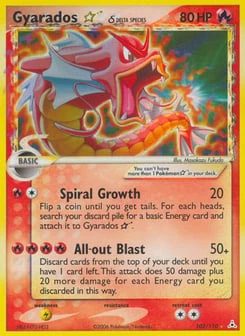 Gyarados ☆ δHolon Phantoms · #102 | $6,404 | 2.4% | +10.0% |
| 10 | 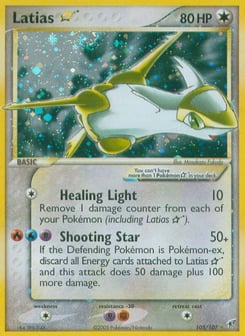 Latias ☆Deoxys · #105 | $6,000 | 2.2% | +0.0% |
| 11 | 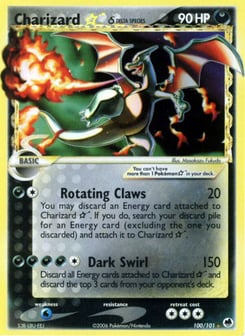 Charizard ☆ δDragon Frontiers · #100 | $5,939 | 2.2% | -7.1% |
| 12 | 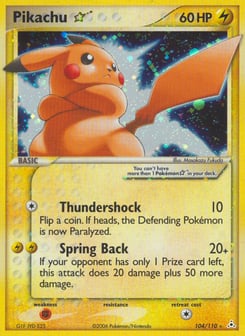 Pikachu ☆Holon Phantoms · #104 | $5,900 | 2.2% | +3.9% |
| 13 | 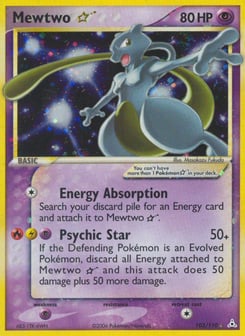 Mewtwo ☆Holon Phantoms · #103 | $4,250 | 1.6% | -6.5% |
| 14 | 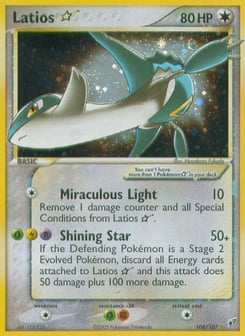 Latios ☆Deoxys · #106 | $4,200 | 1.6% | +12.1% |
| 15 |  Mew30th Celebration · #R | $4,075 | 1.5% | — |
| 16 | 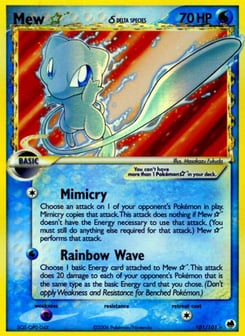 Mew ☆ δDragon Frontiers · #101 | $4,000 | 1.5% | -1.2% |
| 17 | 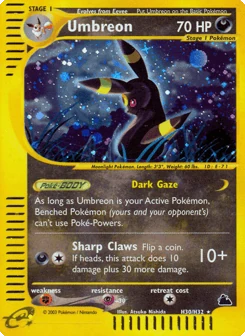 UmbreonSkyridge · #H30 | $4,000 | 1.5% | -1.9% |
| 18 | 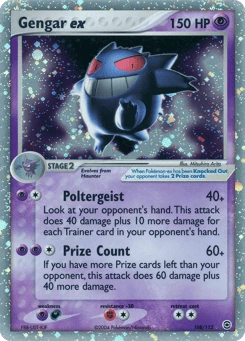 Gengar exFireRed & LeafGreen · #108 | $3,867 | 1.4% | +1.9% |
| 19 | 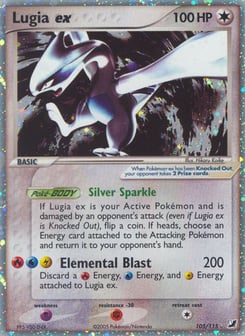 Lugia exUnseen Forces · #105 | $3,767 | 1.4% | +64.6% |
| 20 | 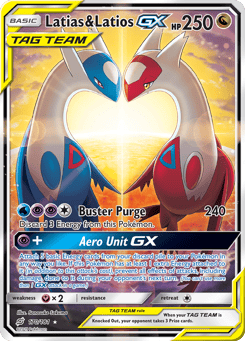 Latias & Latios-GXTeam Up · #170 | $3,600 | 1.3% | +33.3% |
| 21 |  Mew30th Celebration · #B | $3,600 | 1.3% | — |
| 22 |  Mew30th Celebration · #G | $3,400 | 1.3% | — |
| 23 | 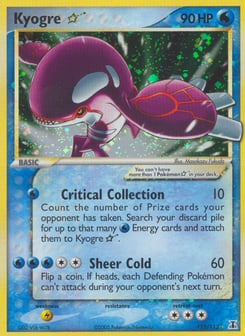 Kyogre ☆Delta Species · #112 | $2,985 | 1.1% | +3.0% |
| 24 | 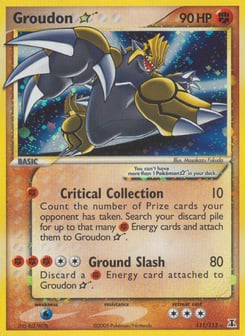 Groudon ☆Delta Species · #111 | $2,952 | 1.1% | +0.0% |
| 25 | 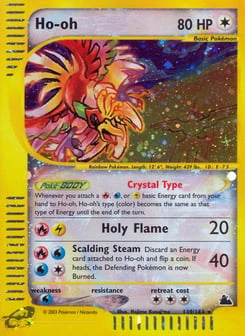 Ho-ohSkyridge · #149 | $2,900 | 1.1% | -3.1% |
| 26 | 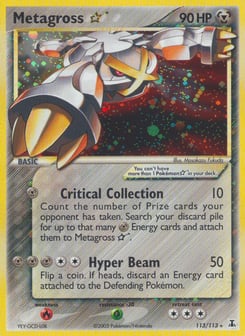 Metagross ☆Delta Species · #113 | $2,900 | 1.1% | +98.6% |
| 27 | 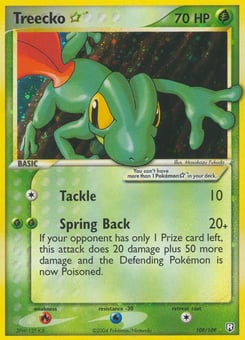 Treecko ☆Team Rocket Returns · #109 | $2,899 | 1.1% | +0.0% |
| 28 | 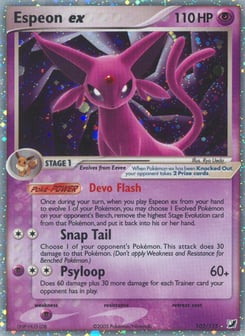 Espeon exUnseen Forces · #102 | $2,601 | 1.0% | +30.0% |
| 29 | 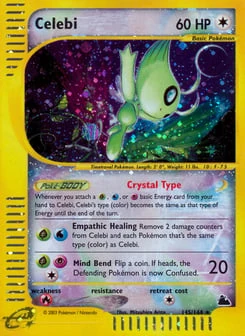 CelebiSkyridge · #145 | $2,500 | 0.9% | +0.0% |
| 30 | 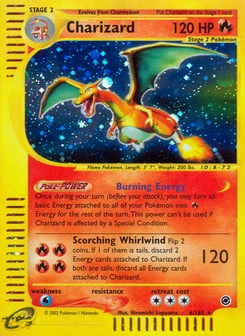 CharizardExpedition Base Set · #6 | $2,400 | 0.9% | +148.0% |
| 31 | 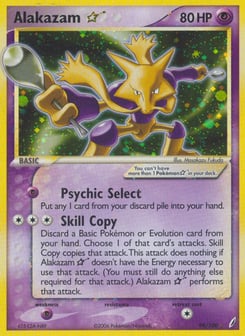 Alakazam ☆Crystal Guardians · #99 | $2,229 | 0.8% | +20.2% |
| 32 | 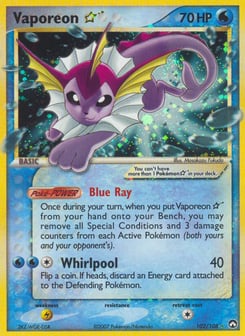 Vaporeon ☆Power Keepers · #102 | $2,200 | 0.8% | +0.0% |
| 33 | 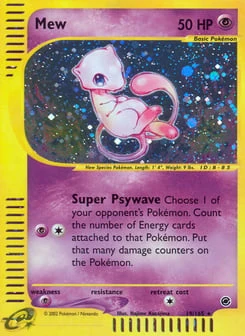 MewExpedition Base Set · #19 | $2,200 | 0.8% | +27.2% |
| 34 | 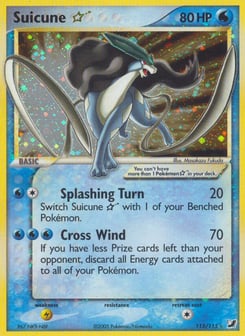 Suicune ☆Unseen Forces · #115 | $2,188 | 0.8% | +40.2% |
| 35 | 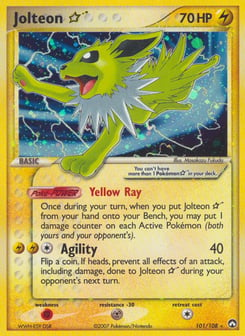 Jolteon ☆Power Keepers · #101 | $2,096 | 0.8% | +11.7% |
| 36 | 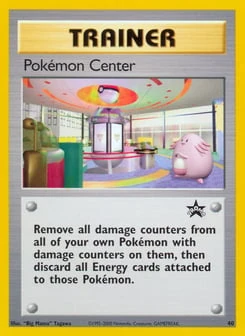 Pokémon CenterWizards Black Star Promos · #40 | $1,999 | 0.7% | +4.2% |
| 37 | 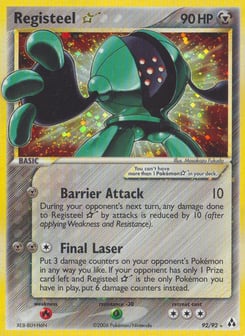 Registeel ☆Legend Maker · #92 | $1,900 | 0.7% | +21.7% |
| 38 | 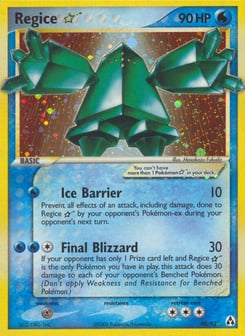 Regice ☆Legend Maker · #90 | $1,893 | 0.7% | +13.9% |
| 39 | 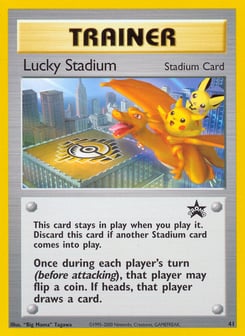 Lucky StadiumWizards Black Star Promos · #41 | $1,864 | 0.7% | +12.7% |
| 40 | 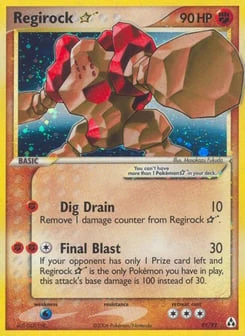 Regirock ☆Legend Maker · #91 | $1,855 | 0.7% | +58.4% |
| 41 | 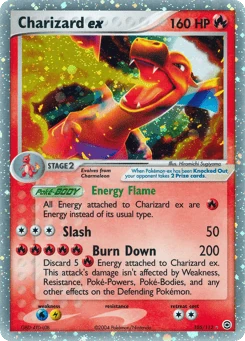 Charizard exFireRed & LeafGreen · #105 | $1,850 | 0.7% | +0.0% |
| 42 | 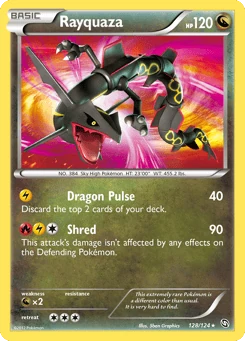 RayquazaDragons Exalted · #128 | $1,800 | 0.7% | +43.1% |
| 43 | 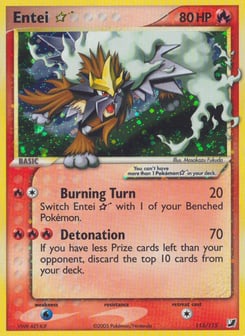 Entei ☆Unseen Forces · #113 | $1,800 | 0.7% | +11.2% |
| 44 | 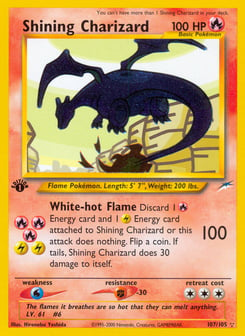 Shining CharizardNeo Destiny · #107 | $1,800 | 0.7% | +0.0% |
| 45 | 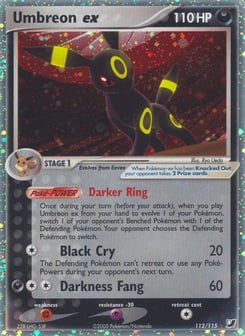 Umbreon exUnseen Forces · #112 | $1,765 | 0.7% | +0.0% |
| 46 | 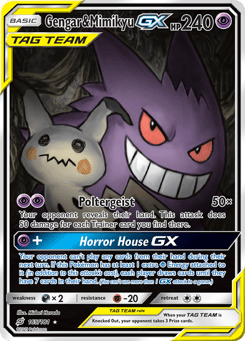 Gengar & Mimikyu-GXTeam Up · #165 | $1,750 | 0.6% | -6.6% |
| 47 | 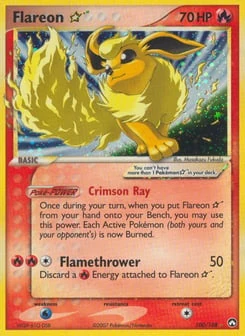 Flareon ☆Power Keepers · #100 | $1,750 | 0.6% | -7.9% |
| 48 | 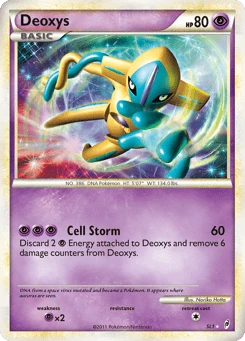 DeoxysCall of Legends · #SL1 | $1,725 | 0.6% | +92.2% |
| 49 | 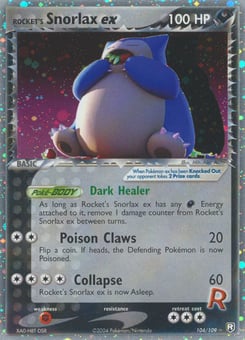 Rocket's Snorlax exTeam Rocket Returns · #104 | $1,722 | 0.6% | +8.5% |
| 50 | 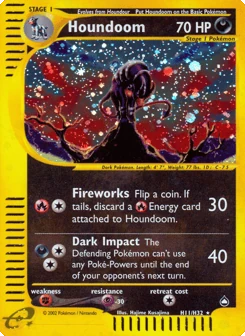 HoundoomAquapolis · #H11 | $1,700 | 0.6% | +9.7% |
| 51 | 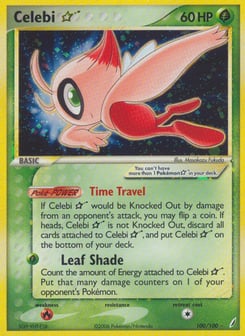 Celebi ☆Crystal Guardians · #100 | $1,693 | 0.6% | +1.4% |
| 52 | 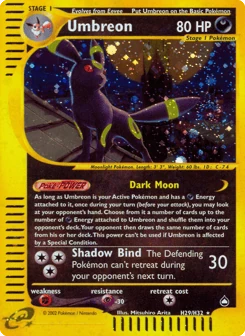 UmbreonAquapolis · #H29 | $1,675 | 0.6% | +15.9% |
| 53 | 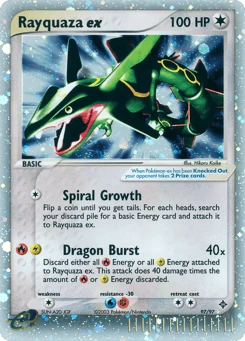 Rayquaza exDragon · #97 | $1,675 | 0.6% | -15.0% |
| 54 | 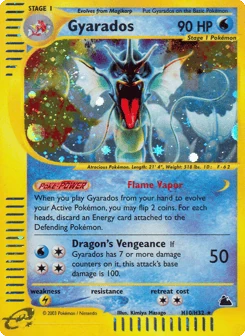 GyaradosSkyridge · #H10 | $1,665 | 0.6% | -0.1% |
| 55 | 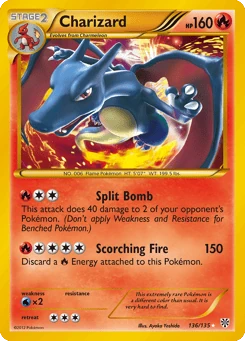 CharizardPlasma Storm · #136 | $1,651 | 0.6% | +0.0% |
| 56 | 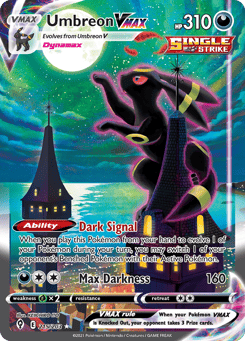 Umbreon VMAXEvolving Skies · #215 | $1,630 | 0.6% | +5.2% |
| 57 | 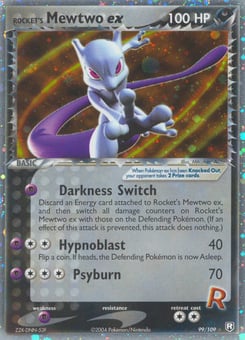 Rocket's Mewtwo exTeam Rocket Returns · #99 | $1,628 | 0.6% | +3.5% |
| 58 | 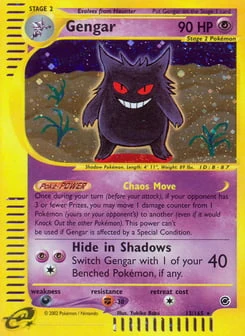 GengarExpedition Base Set · #13 | $1,600 | 0.6% | +52.4% |
| 59 | 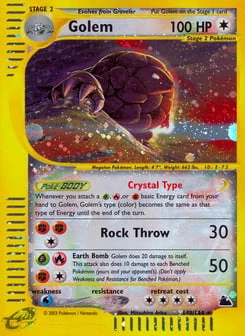 GolemSkyridge · #148 | $1,588 | 0.6% | +52.2% |
| 60 | 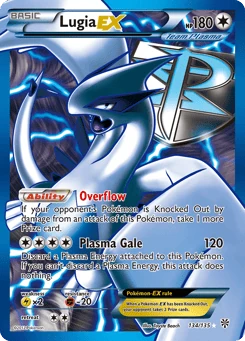 Lugia-EXPlasma Storm · #134 | $1,480 | 0.5% | -13.2% |
| 61 | 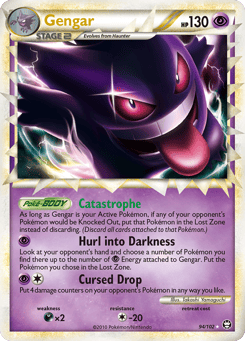 GengarHS—Triumphant · #94 | $1,400 | 0.5% | -23.6% |
| 62 | 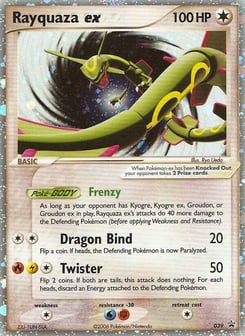 Rayquaza exNintendo Black Star Promos · #39 | $1,350 | 0.5% | +140.3% |
| 63 | $1,320 | 0.5% | -31.0% | |
| 64 | 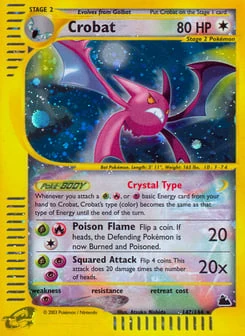 CrobatSkyridge · #147 | $1,308 | 0.5% | -18.9% |
| 65 | 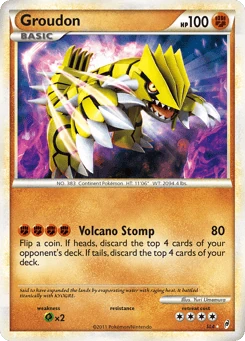 GroudonCall of Legends · #SL4 | $1,300 | 0.5% | +93.6% |
| 66 | 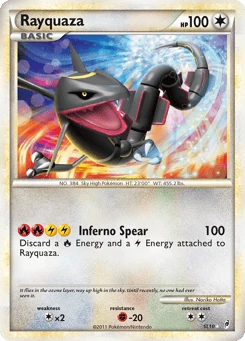 RayquazaCall of Legends · #SL10 | $1,300 | 0.5% | -12.9% |
| 67 | 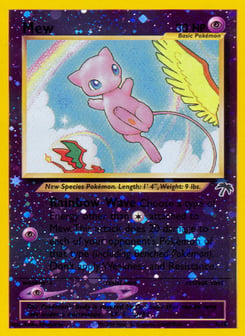 MewSouthern Islands · #1 | $1,300 | 0.5% | +45.3% |
| 68 | 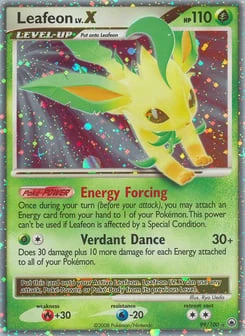 Leafeon LV.XMajestic Dawn · #99 | $1,295 | 0.5% | +79.0% |
| 69 | 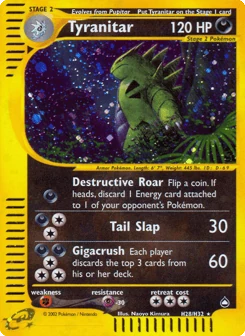 TyranitarAquapolis · #H28 | $1,275 | 0.5% | +26.9% |
| 70 | 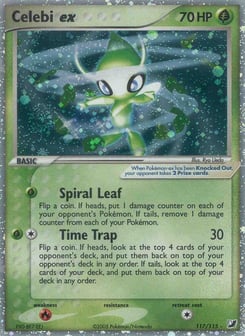 Celebi exUnseen Forces · #117 | $1,250 | 0.5% | +0.0% |
| 71 | 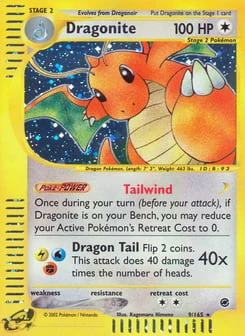 DragoniteExpedition Base Set · #9 | $1,250 | 0.5% | +11.8% |
| 72 | 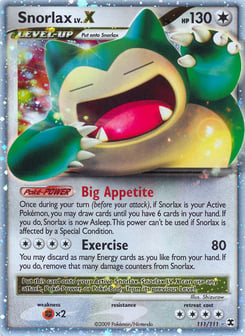 Snorlax LV.XRising Rivals · #111 | $1,247 | 0.5% | -9.5% |
| 73 | 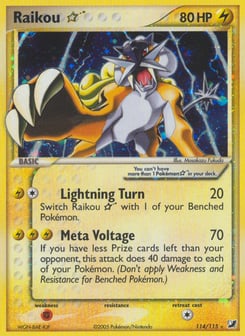 Raikou ☆Unseen Forces · #114 | $1,177 | 0.4% | +4.4% |
| 74 | 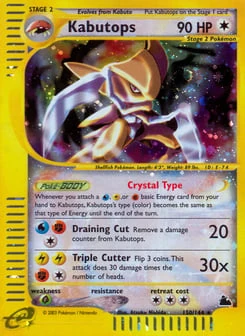 KabutopsSkyridge · #150 | $1,157 | 0.4% | -0.4% |
| 75 | 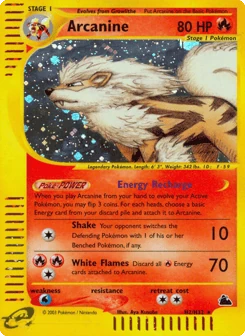 ArcanineSkyridge · #H2 | $1,120 | 0.4% | — |
| 76 | 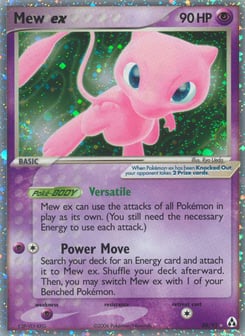 Mew exLegend Maker · #88 | $1,100 | 0.4% | +18.9% |
| 77 | 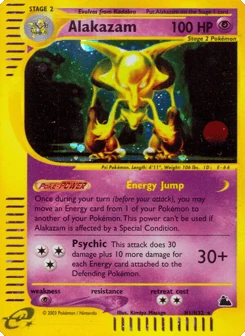 AlakazamSkyridge · #H1 | $1,091 | 0.4% | -27.7% |
| 78 | 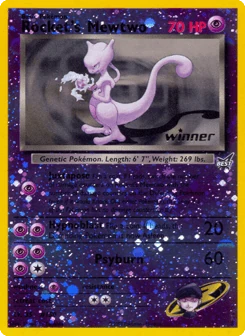 Rocket's MewtwoBest of Game · #8 | $1,085 | 0.4% | +21.9% |
| 79 | 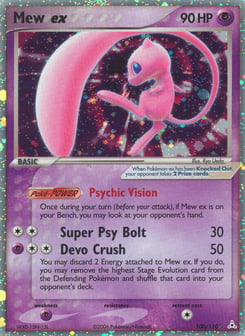 Mew exHolon Phantoms · #100 | $1,050 | 0.4% | +8.1% |
| 80 | 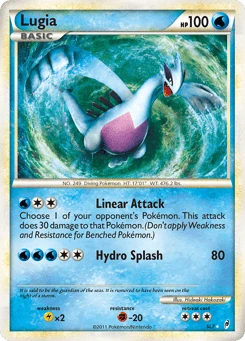 LugiaCall of Legends · #SL7 | $1,050 | 0.4% | -0.4% |
| 81 | 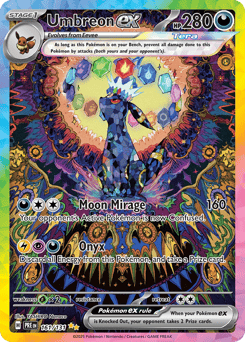 Umbreon exPrismatic Evolutions · #161 | $1,030 | 0.4% | -11.0% |
| 82 | 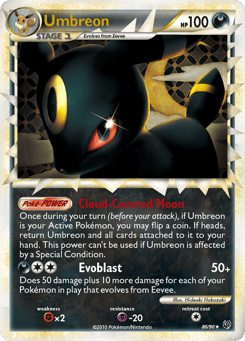 UmbreonHS—Undaunted · #86 | $1,030 | 0.4% | +1.7% |
| 83 | 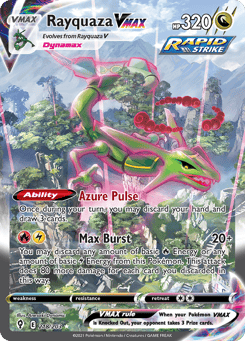 Rayquaza VMAXEvolving Skies · #218 | $1,000 | 0.4% | +0.0% |
| 84 | 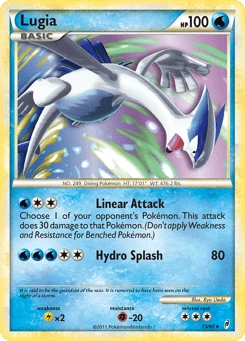 LugiaCall of Legends · #15 | $1,000 | 0.4% | +0.0% |
| 85 | 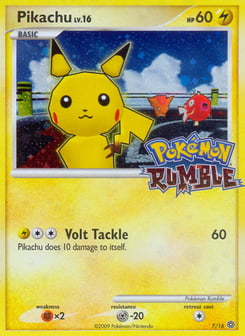 PikachuPokémon Rumble · #7 | $1,000 | 0.4% | -33.3% |
| 86 | 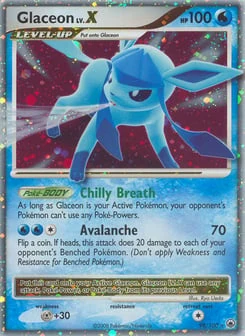 Glaceon LV.XMajestic Dawn · #98 | $1,000 | 0.4% | +136.1% |
| 87 | 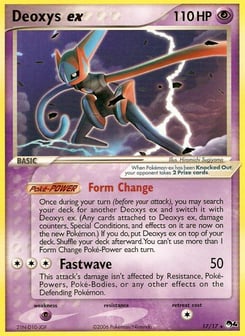 Deoxys exPOP Series 4 · #17 | $1,000 | 0.4% | +0.0% |
| 88 | 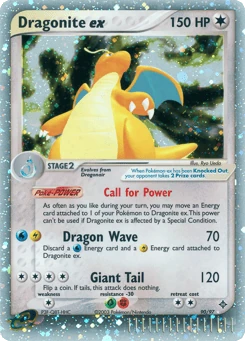 Dragonite exDragon · #90 | $1,000 | 0.4% | +2.1% |
| 89 | $1,000 | 0.4% | +4.5% | |
| 90 | 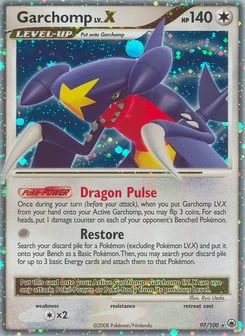 Garchomp LV.XMajestic Dawn · #97 | $960 | 0.4% | -16.4% |
| 91 | 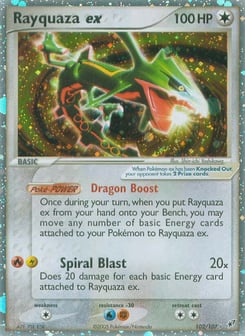 Rayquaza exDeoxys · #102 | $951 | 0.4% | -0.9% |
| 92 | 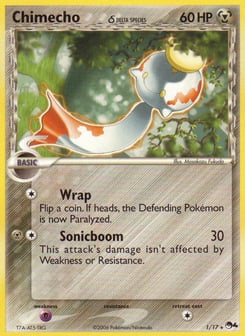 Chimecho δPOP Series 4 · #1 | $946 | 0.4% | +0.0% |
| 93 | $940 | 0.3% | -20.1% | |
| 94 | 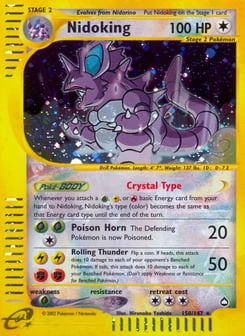 NidokingAquapolis · #150 | $925 | 0.3% | -4.7% |
| 95 | 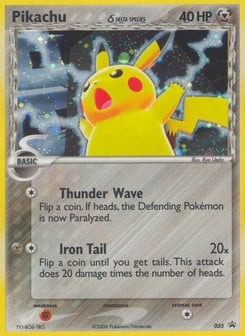 Pikachu δNintendo Black Star Promos · #35 | $900 | 0.3% | — |
| 96 | 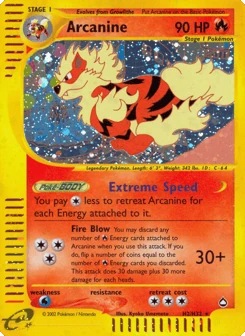 ArcanineAquapolis · #H2 | $900 | 0.3% | +68.0% |
| 97 | 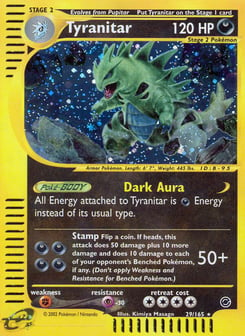 TyranitarExpedition Base Set · #29 | $900 | 0.3% | +51.8% |
| 98 | 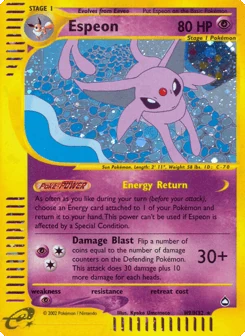 EspeonAquapolis · #H9 | $883 | 0.3% | -19.5% |
| 99 | 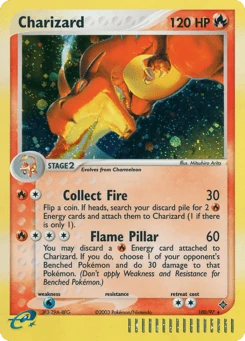 CharizardDragon · #100 | $882 | 0.3% | +17.9% |
| 100 | 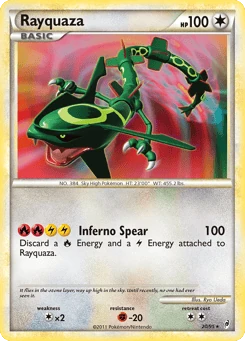 RayquazaCall of Legends · #20 | $870 | 0.3% | +25.8% |
Export the basket: constituents CSV (rank, id, weight, price, trend) · history CSV. Historical baskets are not yet stored — each month's constituents are replaced at rebalance, so only the current basket can be exported.
For media
Free to cite · CC-BY 4.0- Updated
- RefreshesDaily; basket re-ranked monthly
- SourceCardTrack market pricing (near-mint raw) for the live tail; monthly PriceCharting sales history back to the base date; Yahoo Finance and FRED for the benchmark assets.
Source: CardTrack, The CardTrack 100 (CT100), 15 November 2026. https://cardtrack.com/ct100- PNGIndex chart (1200×630)
- CSVMonthly history
- CSVCurrent constituents
- HTMLLive embeddable widget
- DOCMethodology
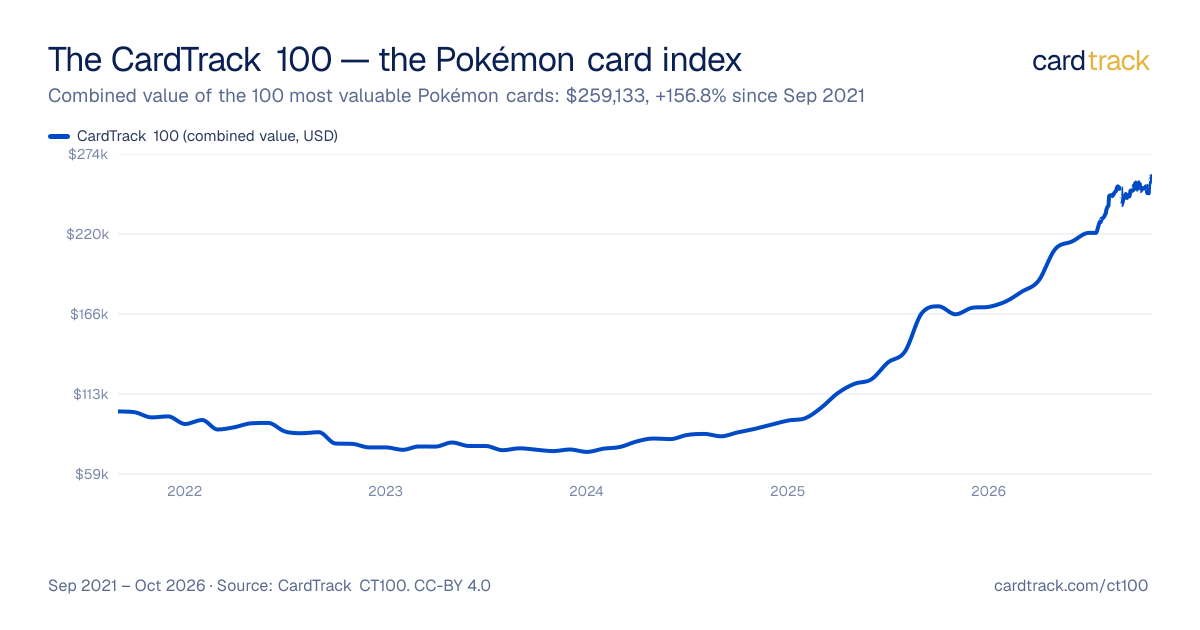
Charts and tables may be reproduced with the attribution above under CC-BY 4.0. How the numbers are built: methodology. Press enquiries, corrections and custom cuts of the data: jd@cardtrack.com. CardTrack is a market measure, not investment advice.
Explore the market
The CT100 is one lens on the Pokémon card market. These pages carry the prices and tools it is built from.
Methodology changes
Every change to how the index is built, dated from the data files themselves. Nothing is restated from memory.
- 2021-09-01 — Index base date (level 100): the 100 most valuable single Pokémon cards, value-weighted, rebalanced monthly.
- 2026-06-30 — Public launch of /ct100 with the Dataset, CSV history and embed widget.
The CT100 is a market measure, not a security or a fund. Nothing here is an offer, a recommendation or investment advice.
Methodology
What it tracks
The CardTrack 100 is the 100 most valuable single Pokémon cards we track, selected purely by current market value. The basket is recomputed on every build, so as prices move, cards drop in and out of the top 100.
The index
It's a value-weighted index (Σ price[t] / Σ price[base] × 100), rebased to 100 at the base date 2021-09-01 — so the priciest cards move it most, the same way a market-cap index works. The headline number is the basket's live combined value. The series is kept in US dollars; the chart and headline are shown in your display currency, and the return and risk table stays in US dollars so the benchmarks compare like for like.
History & coverage
The historical line isn't today's basket projected backward — it's re-ranked and chain-linked every month. At each month we take the actual top 100 by value at that time (drawn from every Pokémon card with deep PriceCharting history — not just today's holdings), then chain that period's return onto the index. So a card entering or leaving the top 100 doesn't create a fake jump — only the actual price moves of whoever was “held” during that step do, the same way a real market-cap index rebalances. Membership is also sticky: a card only drops out once a challenger clearly overtakes it (by more than 10%) — small month-to-month wobble near the #100 cutoff doesn't churn the basket. History back to 2021-09-01 is monthly, from PriceCharting sales; the recent tail is live daily market pricing.
Vintage and Modern
The same index, run on each half of the catalogue. A card is Vintage if its set was released 1999–2010 and Modern if it was released 2011 onward. The line falls where Black & White began, so everything from the WOTC sets through HeartGold & SoulSilver is vintage. Each half is its own top 100, ranked, weighted, rebalanced and chain-linked exactly like the CardTrack 100, so the three are separate indices: the CardTrack 100 is not an average of the other two. Today 83 of its 100 cards are vintage.
Price basis
A Raw (Near-Mint) index. Prices are our continuous market value (TCGplayer/Cardmarket blends via our catalog). A PSA 10 (graded) series is planned for v2.
Data sources
Market prices from our pricing pipeline; the long-run history uses PriceCharting sales. For informational purposes — not financial advice.