Pokémon cards vs Bitcoin, gold, stocks and inflation
The CardTrack 100 — the 100 most valuable Pokémon cards as one index — measured against six traditional assets over the same days, with return, drawdown and volatility side by side. Rebased to 100 in Sep 2021, when the index begins.
Each asset rebased to 100 on 1 Sept 2021, measured to 24 Oct 2026. The line is the asset's running level; hover for recorded values.
Return and risk, Sep 2021 → Oct 2026
| Asset | Total return | Annualised | Max drawdown | Volatility | $1,000 became | Measured over |
|---|---|---|---|---|---|---|
| 1. CardTrack 100 (Pokémon cards) | +156.8% | +20.1%a year | -27.0% | 14.6% | $2,568 | Sep 2021 → Oct 2026 |
| 2. Gold | +139.4% | +18.7%a year | -15.8% | 16.0% | $2,394 | Sep 2021 → Oct 2026 |
| 3. Bitcoin | +91.6% | +13.7%a year | -73.0% | 54.3% | $1,916 | Sep 2021 → Oct 2026 |
| 4. Nasdaq Composite | +89.4% | +13.4%a year | -33.1% | 20.0% | $1,894 | Sep 2021 → Oct 2026 |
| 5. S&P 500 | +81.3% | +12.4%a year | -24.8% | 15.5% | $1,813 | Sep 2021 → Oct 2026 |
| 6. US house prices | +24.3% | +4.6%a year | -5.0% | 2.7% | $1,243 | Sep 2021 → Jul 2026 (to its latest print) |
| 7. US consumer prices (CPI) | +22.0% | +4.1%a year | -0.4% | 1.0% | $1,220 | Sep 2021 → Aug 2026 (to its latest print) |
Annualised = compound annual growth rate. Max drawdown = the deepest peak-to-trough fall inside the window. Volatility = standard deviation of monthly changes, annualised; the CT100 is sampled monthly for this so a day's move is never compared with a month's. Stock indices are price indices (no dividends). Not investment advice.
For media
Free to cite · CC-BY 4.0- Updated
- RefreshesDaily (card index); benchmarks monthly
- SourceCardTrack 100 (CardTrack); Bitcoin, S&P 500, Nasdaq and gold from Yahoo Finance monthly closes; CPI and Case-Shiller house prices from FRED.
Source: CardTrack, Pokémon cards vs traditional assets, 24 October 2026. https://cardtrack.com/data/pokemon-vs-assets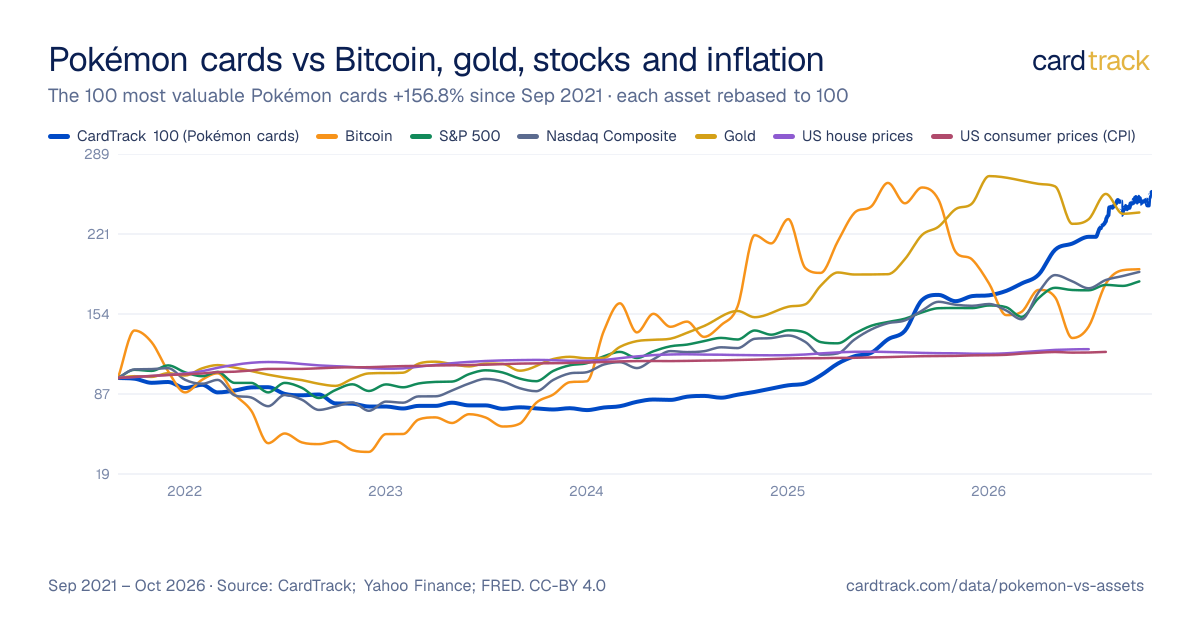
Charts and tables may be reproduced with the attribution above under CC-BY 4.0. How the numbers are built: methodology. Press enquiries, corrections and custom cuts of the data: jd@cardtrack.com. CardTrack is a market measure, not investment advice.
Frequently asked
Have Pokémon cards outperformed Bitcoin, gold and the S&P 500?
Since Sep 2021, the CardTrack 100 index of the 100 most valuable Pokémon cards is +156.8%. That is ahead of Bitcoin (+91.6%), S&P 500 (+81.3%), Nasdaq Composite (+89.4%), Gold (+139.4%), US house prices (+24.3%), US consumer prices (CPI) (+22.0%). It ranks 1st of 7 assets over that window. Over the last year it is +55.9%.
Are Pokémon cards riskier than stocks?
Measured by the deepest fall inside the window, the CardTrack 100's maximum drawdown since Sep 2021 is -27.0%, against -73.0% for Bitcoin, -24.8% for S&P 500, -33.1% for Nasdaq Composite, -15.8% for Gold, -5.0% for US house prices, -0.4% for US consumer prices (CPI). Annualised volatility was 14.6% for the cards and 54.3% for Bitcoin. The index cannot be bought or sold as a whole, and single cards are far less liquid than any of these markets.
Have Pokémon cards beaten inflation?
US consumer prices rose +22.0% between Sep 2021 and Aug 2026 (the latest CPI print). The CardTrack 100 rose +156.8% over the same stretch, a real (inflation-adjusted) return of about +110.5%.
What is the CardTrack 100?
A value-weighted index of the 100 most valuable raw (ungraded, near-mint) Pokémon cards, re-ranked every month and chain-linked so cards entering or leaving the basket never create a jump. Base 100 = September 2021. It is published daily at cardtrack.com/ct100 under CC-BY 4.0.
Methodology
One window, every asset
Each comparison is measured over the CardTrack 100's own window — 1 year, 3 years, 5 years, since inception — ending on the index's latest priced day. Every other series is read as-of the window's start and end, so no two assets are ever compared over different stretches of time. A benchmark that publishes in arrears (CPI, house prices) is measured to its latest print and the table says so.
The statistics
- Total return = end ÷ start − 1. Annualised = compound annual growth over the exact number of days.
- Max drawdown = the deepest peak-to-trough fall inside the window, on the points the series actually has.
- Volatility = sample standard deviation of month-over-month log returns × √12. The CT100 is monthly for most of its history and daily recently; it is resampled to one point per month here so a daily move is never compared with a monthly one.
The series
- CardTrack 100 (Pokémon cards) (CT100): CardTrack, the 100 most valuable Pokémon cards, value-weighted, rebalanced monthly.
- Bitcoin (BTC-USD): Yahoo Finance, monthly close.
- S&P 500 (^GSPC): Yahoo Finance, monthly close (price index, dividends excluded).
- Nasdaq Composite (^IXIC): Yahoo Finance, monthly close (price index, dividends excluded).
- Gold (GC=F): Yahoo Finance, front-month futures, monthly close.
- US house prices (CSUSHPINSA): S&P CoreLogic Case-Shiller US National Home Price Index, FRED (publishes ~2 months in arrears).
- US consumer prices (CPI) (CPIAUCSL): US CPI, all urban consumers, seasonally adjusted, FRED/BLS (publishes ~2 weeks in arrears).
Stock indices are price indices; a total-return version with dividends would be higher. Gold is the front-month futures close. The CardTrack 100 is a raw near-mint index; its long history is monthly from PriceCharting sales and the recent tail is CardTrack's daily market pricing — see the index methodology. None of this is investment advice: the index cannot be bought, and single cards carry dealer spreads and grading costs no benchmark here has.