Pokémon card dollar volume: how concentrated the money is
$198.6M changed hands on 460,549 Pokémon card sales of known price, 15 Sep to 14 Oct 2026. The most expensive 1% of sales ($5,520 and up) made 64.3% of the dollars; 209 cards made half. Sales under $20 were 49.6% of transactions and 0.86% of the money.
Cite this study
Free to cite · CC BY 4.0Source: CardTrack, Dollar-volume concentration, October 2026 edition, 17 October 2026. https://cardtrack.com/data/market-concentration/2026-10https://cardtrack.com/data/market-concentration/2026-10https://cardtrack.com/data/market-concentrationKey findings: Dollar-volume concentration, October 2026 · 460,549 sales of known price, English and Japanese cards, eBay, Fanatics Collect, Alt and Goldin, 15 Sep to 14 Oct 2026
- 1The top 1% of Pokémon card sales by price (4,606 sales of $5,520 or more) made 64.3% of the $198.6M spent, and the top 10% made 90.2% (CardTrack, 15 Sep to 14 Oct 2026).
- 2In CardTrack's sold ledger (15 Sep to 14 Oct 2026), 209 Pokémon cards (0.79% of the 26,571 that sold) took half the money; the top 10 cards took 8.3% and the top 100 36.3%.
- 3Pokémon card sales under $20 were 49.6% of sales but 0.86% of dollars in CardTrack's ledger (15 Sep to 14 Oct 2026); raw cards were 66.2% of sales and 7.8% of dollars.
- 4Without the 217 Pokémon card sales over $100,000 (24.1% of the money), the top 1% of the remaining sales still took 53.8% (CardTrack, 15 Sep to 14 Oct 2026).
- 5Fanatics Collect carried 9.6% of Pokémon card sales and 42.7% of dollars in CardTrack's ledger (15 Sep to 14 Oct 2026); 4 Mondays made 94.3% of its dollars.
Share of Pokémon card sales and dollars by price band· share of sales against share of dollars
Sales under $20 were 49.6% of sales and 0.86% of the dollars.
| Sale price | Sales | Share of sales | Dollars | Share of $ | Median |
|---|---|---|---|---|---|
| Under $5 | 99,074 | 21.5% | $251,292 | 0.1% | $2.25 |
| $5 to $19.99 | 129,360 | 28.1% | $1,460,150 | 0.7% | $10.50 |
| $20 to $49.99 | 76,799 | 16.7% | $2,489,897 | 1.3% | $31 |
| $50 to $99.99 | 48,410 | 10.5% | $3,442,976 | 1.7% | $69.99 |
| $100 to $499.99 | 69,618 | 15.1% | $15,606,737 | 7.9% | $195 |
| $500 to $999.99 | 16,292 | 3.5% | $11,482,420 | 5.8% | $690 |
| $1,000 to $4,999.99 | 15,860 | 3.4% | $33,349,013 | 16.8% | $1,794 |
| $5,000 to $24,999.99 | 4,012 | 0.9% | $40,961,725 | 20.6% | $8,500 |
| $25,000 and over | 1,124 | 0.2% | $89,589,619 | 45.1% | $45,600 |
How much of the money do the top cards take?· share of dollars taken by the top of each ranking
Concentration is not an artefact of a few huge sales: the top 1% took 64.3% of the dollars, 53.8% once sales over $100,000 are removed.
| Scope | Sales | Dollars | Top 1% sales | Top 1% cards | Top 1% card+grade | Cards for half | Under $20, $ share |
|---|---|---|---|---|---|---|---|
| English and Japanese | 460,549 | $198.6M | 64.3% | 54.9% | 55.9% | 209 | 0.86% |
| English only | 417,211 | $188.5M | 64.2% | 50.2% | 53.6% | 185 | 0.79% |
| Japanese only | 43,338 | $10.2M | 64.1% | 57.7% | 60.3% | 52 | 2.15% |
| Excluding sales over $100,000 | 460,332 | $150.9M | 53.8% | 46.0% | 45.6% | 322 | 1.13% |
| Excluding Fanatics Collect | 416,294 | $113.8M | 51.8% | 52.8% | 46.8% | 202 | 1.30% |
Definitions: card, card-and-grade line, top 1%
- A card is a card and its printing, all grades together.
- A card-and-grade line is one grade of it (raw is its own grade).
- “Top 1%” ranks cards and lines by dollars and single sales by price.
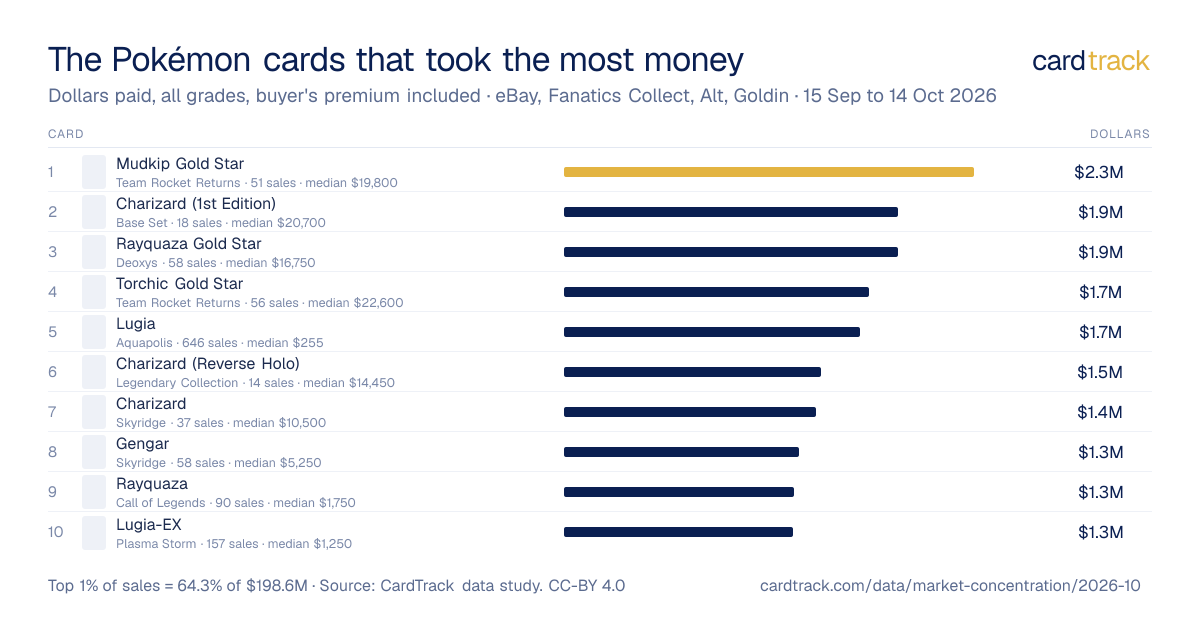
Which Pokémon cards took the most money?· top 100 by dollars, all grades
209 cards took half the money; the top card is the Team Rocket Returns Mudkip ☆, with $2.3M across 51 sales.
| # | Card | Sales | Dollars | Share of $ | Median | Top grade |
|---|---|---|---|---|---|---|
| 1 | 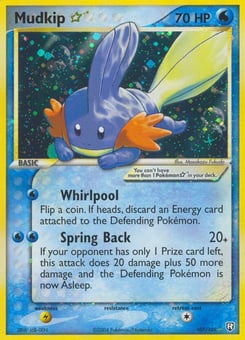 Mudkip ☆Team Rocket Returns · 2004 | 51 | $2,331,601 | 1.17% | $19,800 | PSA 10 43.8% |
| 2 | 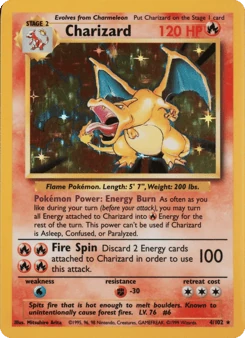 Charizard (1st Edition)Base Set · 1999 | 18 | $1,901,068 | 0.96% | $20,700 | PSA 10 72.9% |
| 3 | 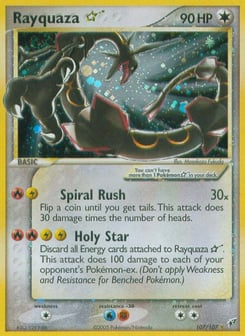 Rayquaza ☆Deoxys · 2005 | 58 | $1,899,592 | 0.96% | $16,750 | PSA 9 20.6% |
| 4 | 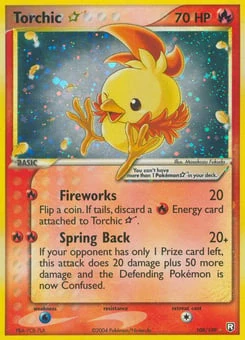 Torchic ☆Team Rocket Returns · 2004 | 56 | $1,737,289 | 0.87% | $22,600 | PSA 9 27.2% |
| 5 | 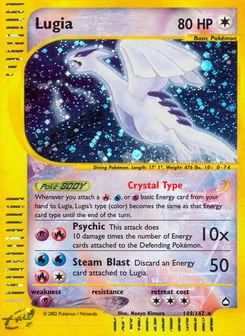 LugiaAquapolis · 2003 | 646 | $1,685,623 | 0.85% | $255 | PSA 10 41.4% |
| 6 | 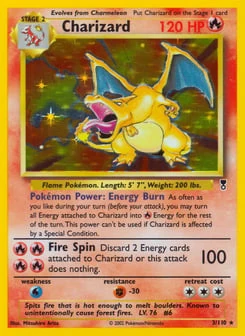 Charizard (Reverse Holo)Legendary Collection · 2002 | 14 | $1,460,884 | 0.74% | $14,450 | PSA 10 86.3% |
| 7 | 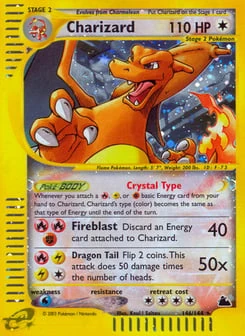 CharizardSkyridge · 2003 | 37 | $1,431,108 | 0.72% | $10,500 | PSA 10 68.6% |
| 8 | 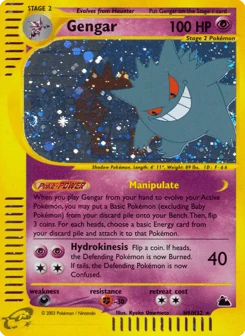 GengarSkyridge · 2003 | 58 | $1,338,215 | 0.67% | $5,250 | PSA 10 48.3% |
| 9 | 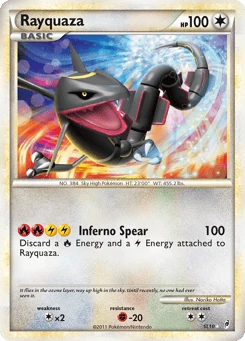 RayquazaCall of Legends · 2011 | 90 | $1,306,619 | 0.66% | $1,750 | PSA 10 60.6% |
| 10 | 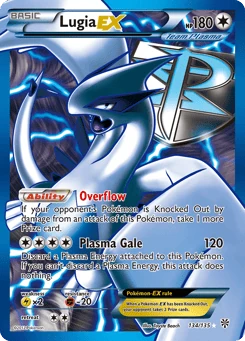 Lugia-EXPlasma Storm · 2013 | 157 | $1,299,994 | 0.65% | $1,250 | PSA 10 50.8% |
| 11 | 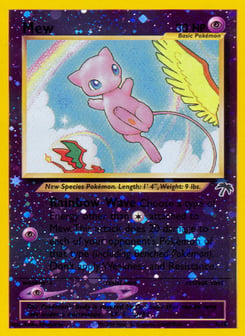 MewSouthern Islands · 2001 | 184 | $1,283,160 | 0.65% | $828 | PSA 10 65.5% |
| 12 | 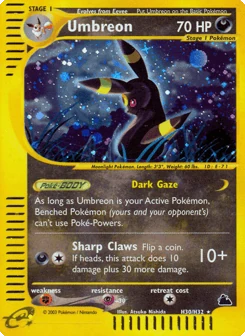 UmbreonSkyridge · 2003 | 42 | $1,189,002 | 0.60% | $5,373 | PSA 10 82.2% |
| 13 | 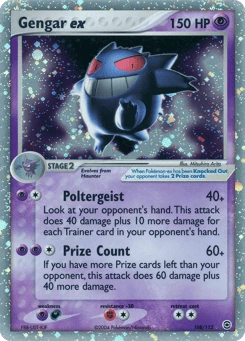 Gengar exFireRed & LeafGreen · 2004 | 143 | $1,134,982 | 0.57% | $2,750 | PSA 10 47.2% |
| 14 | 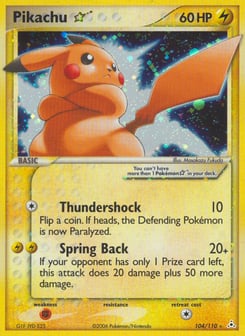 Pikachu ☆Holon Phantoms · 2006 | 59 | $1,131,468 | 0.57% | $8,700 | PSA 10 42.4% |
| 15 | 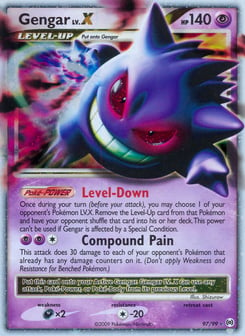 Gengar LV.XArceus · 2009 | 176 | $1,128,758 | 0.57% | $800 | PSA 10 72.4% |
| 16 | 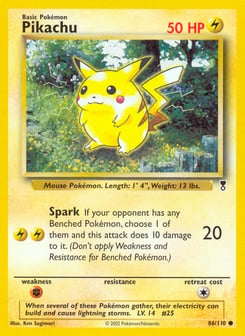 Pikachu (Reverse Holo)Legendary Collection · 2002 | 13 | $1,081,902 | 0.54% | $5,520 | PSA 10 72.1% |
| 17 | 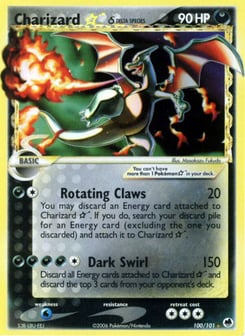 Charizard ☆ δDragon Frontiers · 2006 | 82 | $1,050,577 | 0.53% | $8,275 | PSA 9 20.8% |
| 18 | 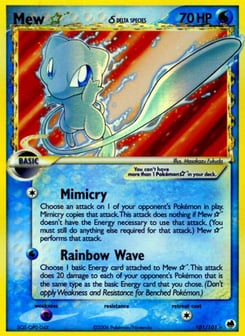 Mew ☆ δDragon Frontiers · 2006 | 94 | $1,025,336 | 0.52% | $4,375 | PSA 10 38.2% |
| 19 | 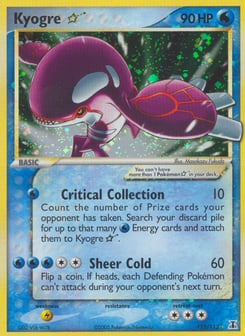 Kyogre ☆Delta Species · 2005 | 39 | $1,002,788 | 0.50% | $3,738 | PSA 10 77.8% |
| 20 | 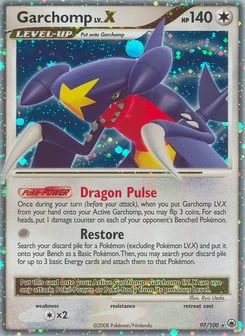 Garchomp LV.XMajestic Dawn · 2008 | 65 | $994,163 | 0.50% | $399 | PSA 10 90.5% |
| 21 | 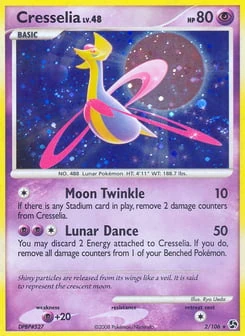 CresseliaGreat Encounters · 2008 | 97 | $990,460 | 0.50% | $17.50 | PSA 10 99.1% |
| 22 | 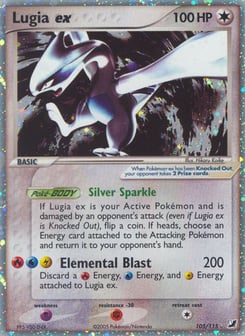 Lugia exUnseen Forces · 2005 | 79 | $936,852 | 0.47% | $1,460 | PSA 10 72.4% |
| 23 | 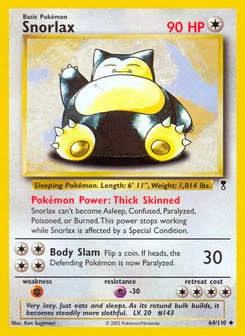 Snorlax (Reverse Holo)Legendary Collection · 2002 | 16 | $882,340 | 0.44% | $6,650 | PSA 10 73.8% |
| 24 | 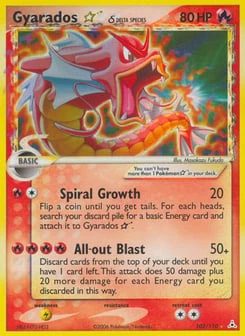 Gyarados ☆ δHolon Phantoms · 2006 | 67 | $877,460 | 0.44% | $6,499 | PSA 8 32.2% |
| 25 | 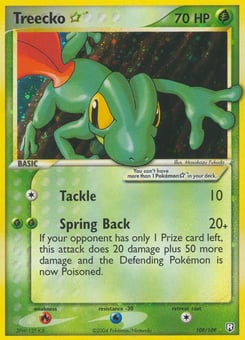 Treecko ☆Team Rocket Returns · 2004 | 33 | $876,408 | 0.44% | $9,600 | PSA 10 57.5% |
| 26 | 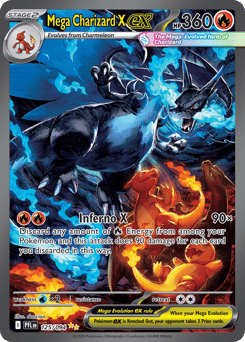 Mega Charizard X exPhantasmal Flames · 2025 | 756 | $853,061 | 0.43% | $850 | PSA 10 54.2% |
| 27 | 25 | $849,965 | 0.43% | $5,640 | PSA 10 76.9% | |
| 28 | 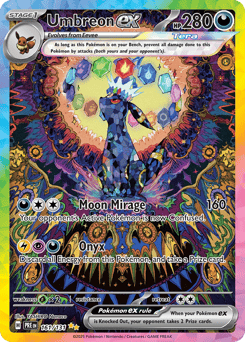 Umbreon exPrismatic Evolutions · 2025 | 385 | $823,320 | 0.41% | $1,275 | PSA 10 45.3% |
| 29 | 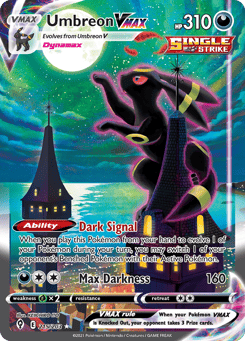 Umbreon VMAXEvolving Skies · 2021 | 277 | $805,595 | 0.41% | $2,400 | PSA 10 52.5% |
| 30 | 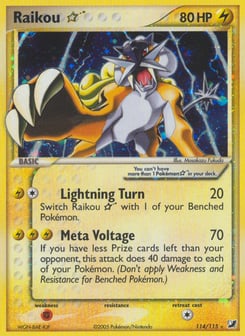 Raikou ☆Unseen Forces · 2005 | 104 | $795,955 | 0.40% | $3,550 | PSA 10 56.9% |
Positions 31 to 100 are in the CSV.
Card-and-grade lines with the most money
| Card | Grade | Sales | Dollars |
|---|---|---|---|
| Charizard (1st Edition)Base Set | PSA 10 | 1 | $1,385,274 |
| Charizard (Reverse Holo)Legendary Collection | PSA 10 | 2 | $1,260,000 |
| Mudkip ☆Team Rocket Returns | PSA 10 | 1 | $1,020,000 |
| CharizardSkyridge | PSA 10 | 5 | $982,000 |
| CresseliaGreat Encounters | PSA 10 | 4 | $981,300 |
| UmbreonSkyridge | PSA 10 | 6 | $977,655 |
| Garchomp LV.XMajestic Dawn | PSA 10 | 1 | $900,000 |
| MewSouthern Islands | PSA 10 | 1 | $840,000 |
| Gengar LV.XArceus | PSA 10 | 4 | $816,892 |
| RayquazaCall of Legends | PSA 10 | 1 | $791,622 |
| Pikachu (Reverse Holo)Legendary Collection | PSA 10 | 1 | $780,000 |
| Kyogre ☆Delta Species | PSA 10 | 5 | $780,000 |
| LugiaAquapolis | PSA 10 | 7 | $697,540 |
| Lugia exUnseen Forces | PSA 10 | 5 | $678,200 |
| Lugia-EXPlasma Storm | PSA 10 | 1 | $660,000 |
Sets · top 25 of 386 by dollars
| Set | Sales | Share of $ | Top card share |
|---|---|---|---|
 Legendary Collection2002 | 2,199 | 7.0% | 10.5% |
 Skyridge2003 | 3,560 | 5.1% | 14.2% |
 Team Rocket Returns2004 | 2,516 | 3.6% | 32.4% |
 Aquapolis2003 | 3,950 | 3.0% | 28.4% |
 Expedition Base Set2002 | 4,229 | 2.6% | 13.1% |
 Holon Phantoms2006 | 2,435 | 2.6% | 22.0% |
 Unseen Forces2005 | 2,701 | 2.5% | 18.9% |
 Deoxys2005 | 1,923 | 2.5% | 38.5% |
 Call of Legends2011 | 2,075 | 2.4% | 28.0% |
 Base Set1999 | 11,940 | 2.3% | 41.6% |
 Delta Species2005 | 2,708 | 2.1% | 24.6% |
 Neo Destiny2002 | 3,326 | 1.9% | 11.8% |
 Neo Revelation2001 | 2,281 | 1.8% | 16.8% |
 Southern Islands2001 | 1,250 | 1.8% | 36.3% |
 Dragon Frontiers2006 | 2,279 | 1.6% | 33.0% |
Where the money is spent: venues, raw and graded cards· where the dollars were spent
Fanatics Collect carried 9.6% of sales and 42.7% of the dollars.
| Venue | Sales | Share of $ | Median | Unpriced |
|---|---|---|---|---|
| eBay | 414,053 | 47.9% | $19.99 | 191,017 |
| Fanatics Collect | 44,255 | 42.7% | $26.40 | 0 |
| Alt | 2,117 | 9.1% | $294 | 0 |
| Goldin | 124 | 0.3% | $449 | 0 |
| Sales | Share of sales | Share of $ | Median | |
|---|---|---|---|---|
| Raw | 304,712 | 66.2% | 7.8% | $10 |
| Graded | 155,837 | 33.8% | 92.2% | $102 |
Fanatics Collect: biggest days by share of its dollars
| Day | Weekday | Share of its $ |
|---|---|---|
| 12 Oct | Monday | 29.8% |
| 5 Oct | Monday | 26.7% |
| 28 Sep | Monday | 20.3% |
| 21 Sep | Monday | 17.6% |
| 25 Sep | Friday | 1.9% |
| 22 Sep | Tuesday | 0.6% |
Sales excluded as outliers· 183 fixed-price or offer sales not counted
183 fixed-price or offer sales, $2.5M together, are not counted.
| Card | Grade | Price | Format | Compared with | Multiple |
|---|---|---|---|---|---|
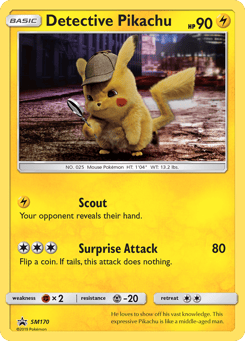 Detective Pikachu2019 POKEMON SM BLACK STAR PROMO #SM170 DETECTIVE PIKACHU-HOLO PSA 10 | PSA 10 | $420,000 | offer | $172 ACE 9, 9 Oct | 2440.4× |
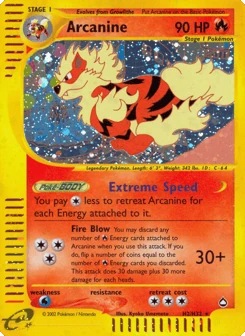 ArcaninePOKEMON ARCANINE AQUAPOLIS HOLO PSA 10 #H2 LOW POP 73 [SWIRL] RARE 💎� | PSA 10 | $200,000 | fixed price | $12,688 PSA 10, 12 Aug | 15.8× |
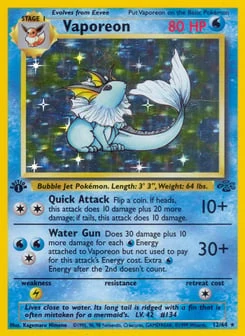 Vaporeon1999 Pokemon Jungle 1st Edition Holo Vaporeon #12 | PSA 10 | $129,999 | offer | $2,130 CGC 10, 27 Jul | 61.0× |
| PSA 10 | $119,999 | fixed price | $168 PSA 10, 20 Aug | 716.4× | |
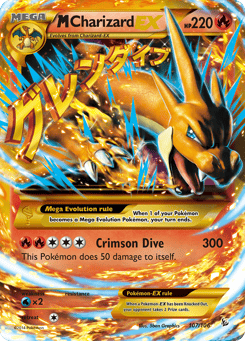 M Charizard-EXPokemon PSA 10 M Charizard Ex #107 Holo XY Flashfire Ultra Rare 2014 E | PSA 10 | $112,152 | fixed price | $854 PSA 9, 7 Aug | 131.3× |
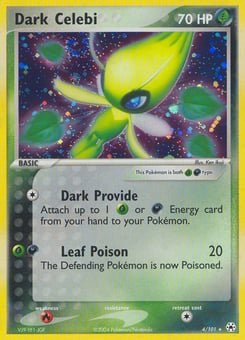 Dark CelebiPokemon 2004 EX Hidden Legends Dark Celebi 4/101 Holo Rare PSA 10 (POP | PSA 10 | $100,000 | fixed price | $3,500 PSA 10, 10 Sep | 28.6× |
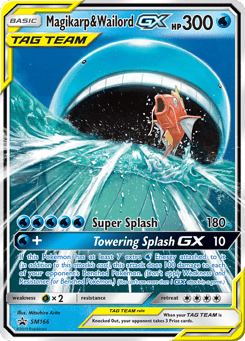 Magikarp & Wailord-GXPOP 10! Magikarp & Wailord GX Black Star Promo #SM166 | Raw | $87,500 | offer | $610 Raw, 15 Jul | 143.4× |
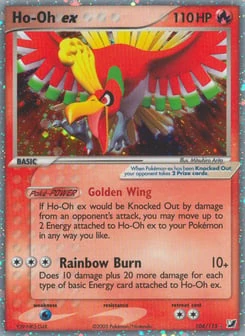 Ho-Oh ex2005 POKEMON EX UNSEEN FORCES #104 HO-OH EX-HOLO UNSEEN FORCES | Raw | $85,000 | fixed price | $1,050 Raw, 17 Aug | 81.0× |
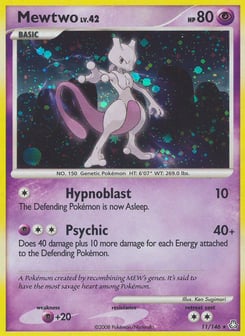 MewtwoPokemon Mewtwo Holo Legends Awakened 11/146 PSA 10 Gem Mint | PSA 10 | $80,000 | fixed price | $3,250 PSA 9, 11 Sep | 24.6× |
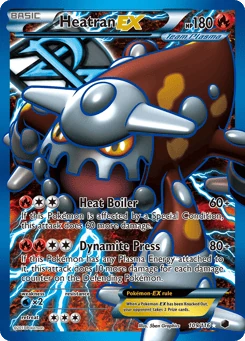 Heatran-EX2013 Pokemon B & W #109 - Heatran EX Full Art - Plazma Freeze - GEM MI | PSA 10 | $64,995 | fixed price | $3,000 PSA 9, 4 Oct | 21.7× |
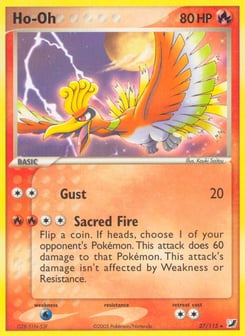 Ho-Oh2005 POKEMON EX UNSEEN FORCES COSMOS #27 HO-OH-HOLO PSA 10 | PSA 10 | $60,000 | fixed price | $1,000 PSA 9, 13 Sep | 60.0× |
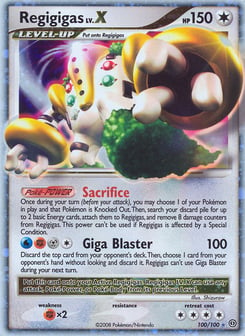 Regigigas LV.X2008 Pokemon Diamond & Pearl Stormfront Holo Regigigas Lv.X #100 PSA 1 | PSA 10 | $55,579 | offer | $450 PSA 8, 23 Aug | 123.5× |
Every excluded sale, with its listing, is in the CSV.
Chart: Dollar-volume concentration
For media
Free to cite · CC-BY 4.0- Updated
- RefreshesMonthly; each edition is kept at its own URL
- SourceCardTrack's sold ledger: eBay (trawl, SoldComps, Scrydex), Fanatics Collect, Alt and Goldin, one sale per listing, price paid including buyer's premium.
Source: CardTrack, Dollar-volume concentration, October 2026, 17 October 2026. https://cardtrack.com/data/market-concentration/2026-10Charts and tables may be reproduced with the attribution above under CC-BY 4.0. How the numbers are built: methodology. Press enquiries, corrections and custom cuts of the data: jd@cardtrack.com. CardTrack is a market measure, not investment advice.
Frequently asked questions: Dollar-volume concentration
How much money is spent on Pokémon cards in a month?
CardTrack's sold ledger recorded $198,633,828 across 460,549 Pokémon card sales of known price at eBay, Fanatics Collect, Alt and Goldin, 15 Sep to 14 Oct 2026. 191,017 more sales had no recorded price.
How concentrated is spending on Pokémon cards?
The most expensive 1% of sales made 64.3% of the dollars, and 209 cards made half of them. Sales under $20 were 49.6% of transactions and 0.86% of the money.
Which Pokémon card took the most money?
The Team Rocket Returns Mudkip ☆: $2,331,601 across 51 sales, 15 Sep to 14 Oct 2026.
Method: how CardTrack built these figures
How the figures are built: what is counted, where the prices come from, thresholds and caveats
What a sale is
- Every sale in CardTrack's sold ledger dated 15 Sep 2026 to 14 Oct 2026, once per listing, at eBay, Fanatics Collect, Alt and Goldin.
- Priced at what the buyer paid, buyer's premium included.
- Only sales with a known price count toward a dollar figure. 191,017 sales (29.3%), mostly eBay offers accepted at an undisclosed amount, are in none.
Scope
English cards and Japanese cards (by their Japanese ids). Copies in other languages filed under an English card id (2,159 sales, $416K) are left out, not credited to the English card.
Outliers
- A fixed-price or accepted-offer sale of $1,000 or more, priced over 10× the highest auction of the same card, printing and grade since 15 Jul 2026, is not counted.
- Where the grade has no auction, a sale of $50,000 or more is compared with the card at any grade.
- Auctions are never excluded. 183 sales were removed this way.
Definitions
“Top 1%” is the ceiling of 1% of the items, ranked by dollars (cards, card-and-grade lines) or by price (single sales). Money is summed in whole cents.
Edition
October 2026 edition, published 17 Oct 2026.
Editions of the Dollar-volume concentration study
- October 2026
Each edition keeps its own page, CSV and chart at /data/market-concentration/<edition>, so a citation of one month's figures keeps pointing at them.