PSA 10 gem rate by set: every English Pokémon set ranked
36.1% of the 16.07M English Pokémon cards PSA has graded are PSA 10s. Among the 136 sets with 10,000+ slabs the gem rate runs from 0.3% (Double Crisis) to 69.9% (Darkness Ablaze); by era from 3.9% (Diamond & Pearl) to 58.5% (Mega Evolution). PSA population of 13 Oct 2026.
Cite this study
Free to cite · CC BY 4.0Source: CardTrack, PSA 10 gem rate by set, October 2026 edition, 17 October 2026. https://cardtrack.com/data/psa-10-rate-by-set/2026-10https://cardtrack.com/data/psa-10-rate-by-set/2026-10https://cardtrack.com/data/psa-10-rate-by-setKey findings: PSA 10 gem rate by set, October 2026 · 16,074,760 PSA-graded copies of 19,544 English cards · PSA population 13 Oct 2026 (17,411 cards), 28 Sep 2026 (2,118)
- 1In CardTrack's PSA population data to 13 Oct 2026, 36.1% of English Pokémon cards graded by PSA are PSA 10s: 5,806,048 of 16,074,760 copies, about one in 3.
- 2By era, the PSA 10 rate on English Pokémon cards runs from 3.9% (Diamond & Pearl) to 58.5% (Mega Evolution) in CardTrack's PSA population data to 13 Oct 2026; Scarlet & Violet is at 34.6%.
- 3In CardTrack's PSA population data to 13 Oct 2026, among English sets with 10,000+ graded copies, Double Crisis has the lowest PSA 10 rate (0.3%, 1 in 311) and Darkness Ablaze the highest (69.9%).
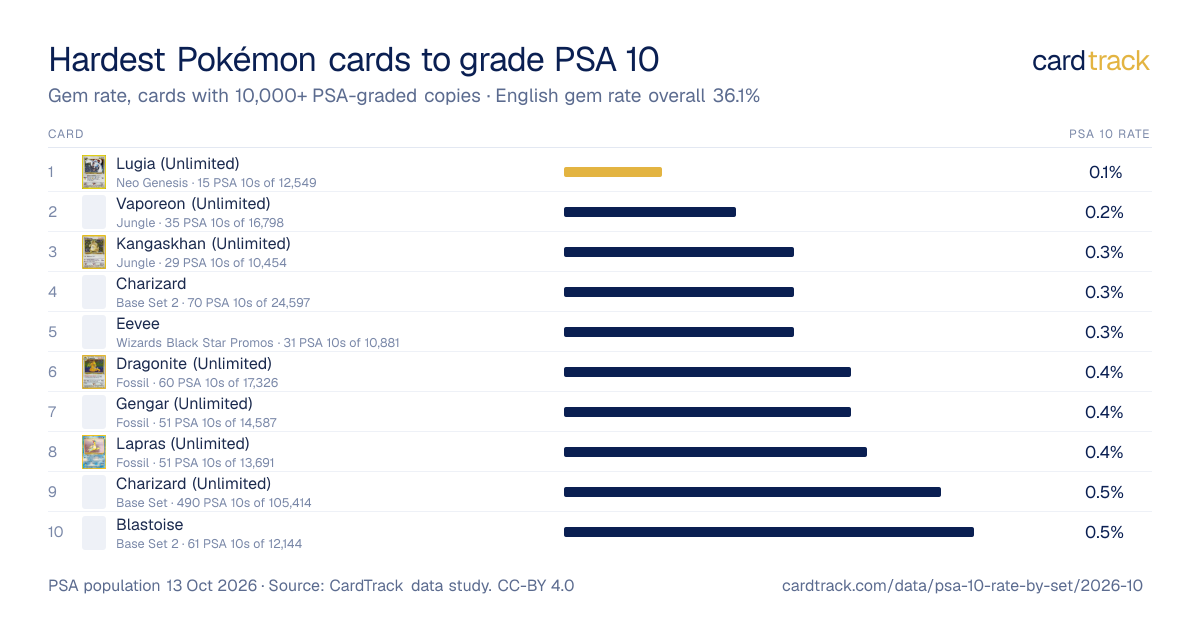
- 4Among English Pokémon cards with 10,000+ PSA copies (CardTrack, PSA population data to 13 Oct 2026), the hardest to grade a PSA 10 is the Neo Genesis Lugia (Unlimited): 15 PSA 10s from 12,549 graded, 1 in 837.
- 5On the same 233 Wizards-era cards, CardTrack's PSA population data to 13 Oct 2026 shows 1st Edition copies graded PSA 10 at 10.2% against 4.4% for Unlimited.
- 6On 5,721 English cards graded 100+ times by both PSA and CGC, PSA's 10 rate is 36.6% and CGC's 33.8% (CardTrack, counts of 16 Oct 2026).
What share of Pokémon cards get a PSA 10, by era and release year?· PSA 10s over every copy PSA has graded
The gem rate runs from 3.9% in Diamond & Pearl to 58.5% in Mega Evolution.
| Era | Cards | Graded | PSA 10 | Gem rate | 1 in |
|---|---|---|---|---|---|
| Wizards of the Coast | 1,775 | 2,027,976 | 166,509 | 8.2% | 12 |
| EX | 1,876 | 471,111 | 41,288 | 8.8% | 11 |
| Diamond & Pearl | 934 | 83,161 | 3,241 | 3.9% | 26 |
| Platinum | 530 | 67,809 | 2,840 | 4.2% | 24 |
| HeartGold & SoulSilver | 543 | 100,573 | 4,203 | 4.2% | 24 |
| Black & White | 1,329 | 151,844 | 9,065 | 6.0% | 17 |
| XY | 1,838 | 913,522 | 155,774 | 17.1% | 6 |
| Sun & Moon | 2,877 | 1,728,308 | 740,618 | 42.9% | 2 |
| Sword & Shield | 3,557 | 4,217,253 | 2,109,808 | 50.0% | 2 |
| Scarlet & Violet | 3,469 | 4,679,284 | 1,617,469 | 34.6% | 3 |
| Mega Evolution | 816 | 1,633,919 | 955,233 | 58.5% | 2 |
| Year | Graded | PSA 10 | Gem rate |
|---|---|---|---|
| 1999 | 1,124,362 | 95,824 | 8.5% |
| 2000 | 496,383 | 21,029 | 4.2% |
| 2001 | 120,636 | 7,299 | 6.0% |
| 2002 | 179,121 | 21,146 | 11.8% |
| 2003 | 215,242 | 29,627 | 13.8% |
| 2004 | 103,704 | 12,570 | 12.1% |
| 2005 | 107,591 | 9,626 | 8.9% |
| 2006 | 119,554 | 8,396 | 7.0% |
| 2007 | 82,370 | 3,525 | 4.3% |
| 2008 | 33,285 | 1,996 | 6.0% |
| 2009 | 67,809 | 2,840 | 4.2% |
| 2010 | 79,354 | 3,344 | 4.2% |
| 2011 | 60,275 | 3,025 | 5.0% |
| 2012 | 37,433 | 3,375 | 9.0% |
| 2013 | 208,834 | 10,441 | 5.0% |
| 2014 | 74,022 | 11,411 | 15.4% |
| 2015 | 135,068 | 16,686 | 12.3% |
| 2016 | 570,953 | 120,760 | 21.1% |
| 2017 | 659,746 | 213,773 | 32.4% |
| 2018 | 122,641 | 51,665 | 42.1% |
| 2019 | 1,647,509 | 683,473 | 41.5% |
| 2020 | 518,146 | 323,372 | 62.4% |
| 2021 | 1,295,483 | 704,429 | 54.4% |
| 2022 | 983,765 | 495,802 | 50.4% |
| 2023 | 3,247,553 | 1,169,366 | 36.0% |
| 2024 | 1,071,077 | 415,141 | 38.8% |
| 2025 | 2,272,610 | 1,083,759 | 47.7% |
| 2026 | 440,234 | 282,348 | 64.1% |
Which Pokémon sets have the lowest and highest PSA 10 rate?· sets with 10,000+ PSA-graded copies
A 10 is 1 in 311 in Double Crisis but 1 in 1 in Darkness Ablaze.
Lowest gem rate
| # | Set | Graded | Gem rate | 1 in |
|---|---|---|---|---|
| 1 |  Double Crisis2015 | 12,745 | 0.3% | 311 |
| 2 |  DP Black Star Promos2007 | 21,417 | 0.9% | 106 |
| 3 |  BW Black Star Promos2011 | 22,345 | 2.0% | 51 |
| 4 |  HS—Undaunted2010 | 20,972 | 2.7% | 37 |
| 5 |  HeartGold & SoulSilver2010 | 15,276 | 2.9% | 34 |
| 6 |  Team Rocket2000 | 135,620 | 2.9% | 34 |
| 7 |  Neo Genesis2000 | 62,544 | 3.1% | 32 |
| 8 |  Secret Wonders2007 | 12,404 | 3.3% | 31 |
| 9 |  Legendary Treasures2013 | 42,277 | 3.6% | 28 |
| 10 |  HS—Unleashed2010 | 10,994 | 3.7% | 27 |
| 11 |  Gym Heroes2000 | 77,045 | 3.7% | 27 |
| 12 |  Fossil1999 | 168,202 | 3.9% | 25 |
| 13 |  Stormfront2008 | 11,388 | 3.9% | 25 |
| 14 |  Call of Legends2011 | 21,219 | 4.0% | 25 |
| 15 |  Neo Revelation2001 | 46,743 | 4.0% | 25 |
Highest gem rate
| # | Set | Graded | Gem rate | 1 in |
|---|---|---|---|---|
| 1 |  Darkness Ablaze2020 | 100,211 | 69.9% | 1 |
| 2 |  Shining Fates Shiny Vault2021 | 87,142 | 69.7% | 1 |
| 3 |  Sword & Shield2020 | 60,025 | 66.9% | 1 |
| 4 |  Rebel Clash2020 | 27,759 | 66.3% | 2 |
| 5 |  Perfect Order2026 | 80,836 | 66.2% | 2 |
| 6 |  Champion's Path2020 | 107,419 | 65.6% | 2 |
| 7 |  Ascended Heroes2026 | 323,823 | 63.8% | 2 |
| 8 |  Silver Tempest Trainer Gallery2022 | 94,652 | 63.0% | 2 |
| 9 |  Chaos Rising2026 | 33,381 | 62.9% | 2 |
| 10 |  Chilling Reign2021 | 111,513 | 61.1% | 2 |
| 11 |  Hidden Fates Shiny Vault2019 | 324,668 | 59.6% | 2 |
| 12 |  Evolving Skies2021 | 345,757 | 59.6% | 2 |
| 13 |  Celebrations: Classic Collection2021 | 282,427 | 59.3% | 2 |
| 14 |  Hidden Fates2019 | 152,790 | 59.3% | 2 |
| 15 |  Mega Evolution Black Star Promos2025 | 495,606 | 59.3% | 2 |
Which Pokémon cards are hardest to grade a PSA 10?· cards with 10,000+ PSA-graded copies
The hardest card gems at 0.1% (Neo Genesis Lugia (Unlimited)), against 36.1% overall.
| # | Card | Graded | PSA 10 | PSA 9 | Gem rate | Odds |
|---|---|---|---|---|---|---|
| 1 | 12,549 | 15 | 495 | 0.1% | 1 in 837 | |
| 2 | 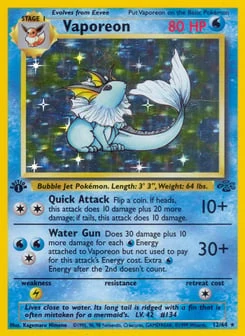 Vaporeon (Unlimited)Jungle · #12 · 1999 | 16,798 | 35 | 964 | 0.2% | 1 in 480 |
| 3 | 10,454 | 29 | 973 | 0.3% | 1 in 360 | |
| 4 | 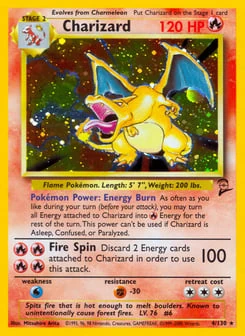 CharizardBase Set 2 · #4 · 2000 | 24,597 | 70 | 1,408 | 0.3% | 1 in 351 |
| 5 | 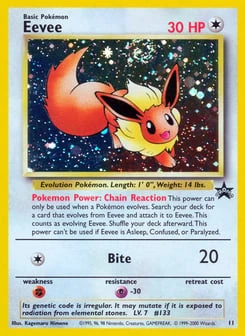 EeveeWizards Black Star Promos · #11 · 1999 | 10,881 | 31 | 1,751 | 0.3% | 1 in 351 |
| 6 | 17,326 | 60 | 1,508 | 0.4% | 1 in 289 | |
| 7 | 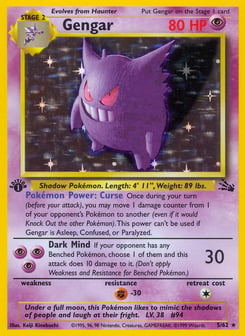 Gengar (Unlimited)Fossil · #5 · 1999 | 14,587 | 51 | 1,184 | 0.4% | 1 in 286 |
| 8 | 13,691 | 51 | 1,264 | 0.4% | 1 in 268 | |
| 9 | 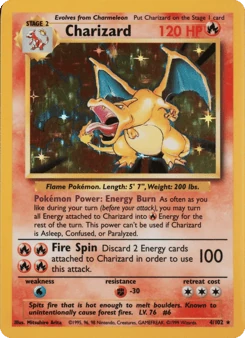 Charizard (Unlimited)Base Set · #4 · 1999 | 105,414 | 490 | 8,548 | 0.5% | 1 in 215 |
| 10 | 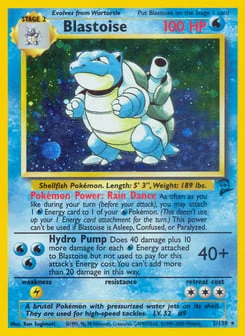 BlastoiseBase Set 2 · #2 · 2000 | 12,144 | 61 | 1,097 | 0.5% | 1 in 199 |
| 11 | 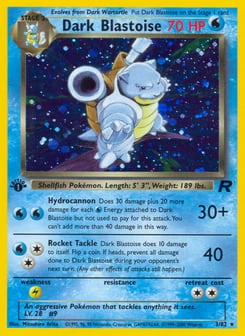 Dark Blastoise (Unlimited)Team Rocket · #3 · 2000 | 11,706 | 65 | 1,159 | 0.6% | 1 in 180 |
| 12 | 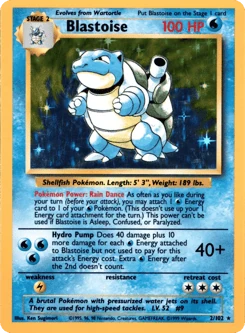 Blastoise (Unlimited)Base Set · #2 · 1999 | 52,335 | 381 | 4,944 | 0.7% | 1 in 137 |
| 13 | 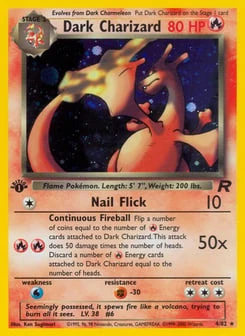 Dark Charizard (Unlimited)Team Rocket · #4 · 2000 | 19,861 | 176 | 2,428 | 0.9% | 1 in 113 |
| 14 | 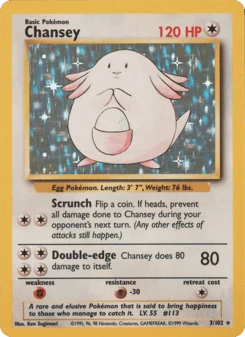 Chansey (Unlimited)Base Set · #3 · 1999 | 16,374 | 147 | 2,114 | 0.9% | 1 in 111 |
| 15 | 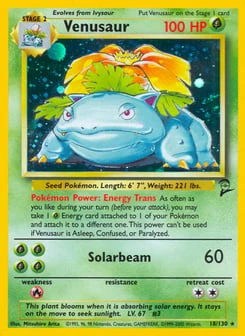 VenusaurBase Set 2 · #18 · 2000 | 10,323 | 107 | 1,341 | 1.0% | 1 in 96 |
Hardest modern cards · Sword & Shield on, 5,000+ graded
| Card | Graded | Gem rate | Odds |
|---|---|---|---|
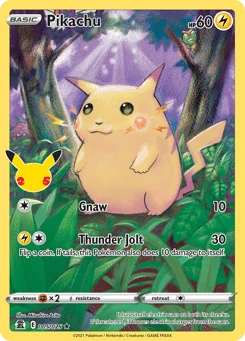 PikachuCelebrations · 2021 | 49,801 | 2.0% | 1 in 51 |
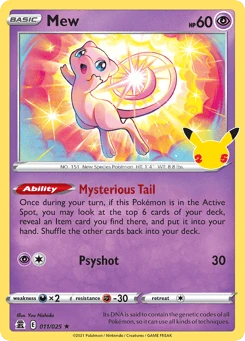 MewCelebrations · 2021 | 17,465 | 2.3% | 1 in 43 |
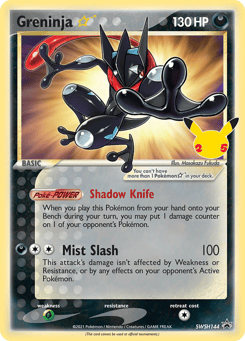 Greninja ☆SWSH Black Star Promos · 2019 | 60,070 | 5.1% | 1 in 20 |
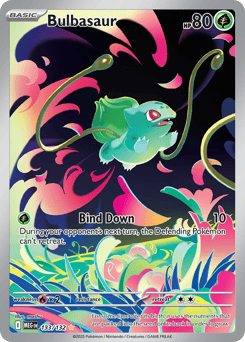 BulbasaurMega Evolution · 2025 | 25,896 | 7.1% | 1 in 14 |
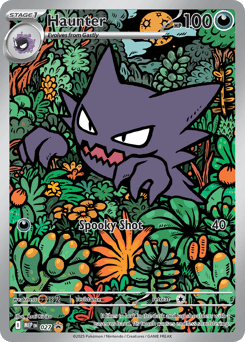 HaunterMega Evolution Black Star Promos · 2025 | 10,135 | 7.4% | 1 in 14 |
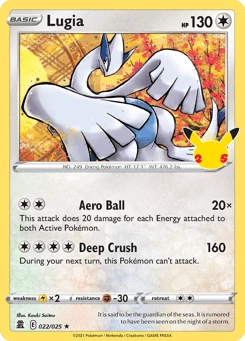 LugiaCelebrations · 2021 | 5,685 | 8.5% | 1 in 12 |
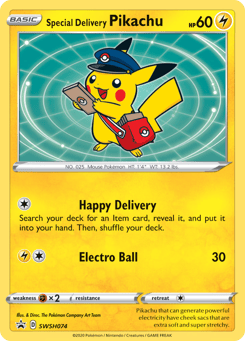 Special Delivery PikachuSWSH Black Star Promos · 2019 | 14,670 | 9.7% | 1 in 10 |
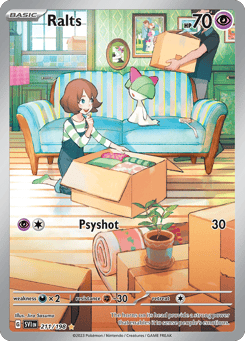 RaltsScarlet & Violet · 2023 | 7,824 | 10.0% | 1 in 10 |
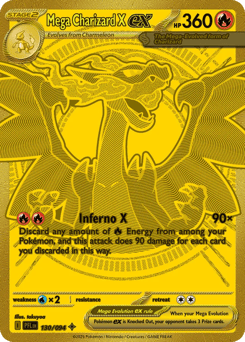 Mega Charizard X exPhantasmal Flames · 2025 | 20,251 | 10.0% | 1 in 10 |
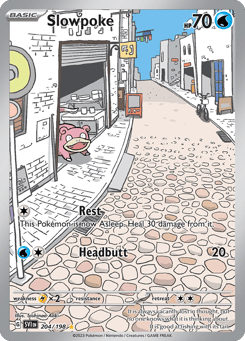 SlowpokeScarlet & Violet · 2023 | 7,769 | 10.7% | 1 in 9 |
Most-graded cards
| Card | Graded | PSA 10 | Gem rate |
|---|---|---|---|
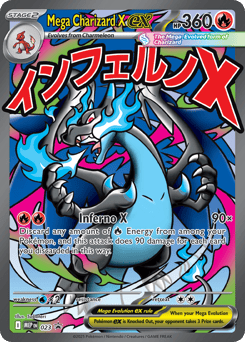 Mega Charizard X exMega Evolution Black Star Promos · 2025 | 125,085 | 60,507 | 48.4% |
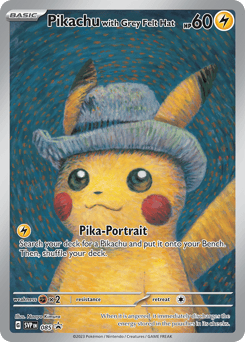 Pikachu with Grey Felt HatScarlet & Violet Black Star Promos · 2023 | 119,426 | 50,526 | 42.3% |
| Charizard (Unlimited)Base Set · 1999 | 105,414 | 490 | 0.5% |
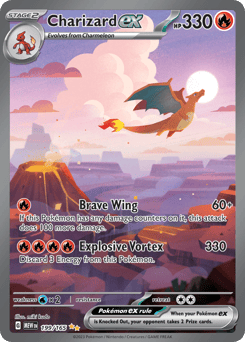 Charizard ex151 · 2023 | 105,341 | 28,824 | 27.4% |
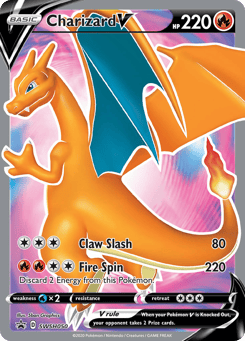 Charizard VSWSH Black Star Promos · 2019 | 91,236 | 51,357 | 56.3% |
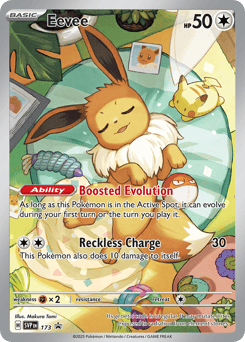 EeveeScarlet & Violet Black Star Promos · 2023 | 84,604 | 31,424 | 37.1% |
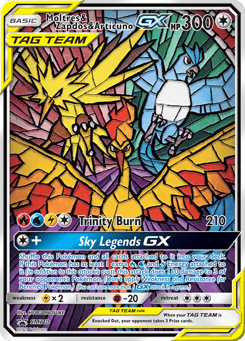 Moltres & Zapdos & Articuno-GXSM Black Star Promos · 2017 | 79,050 | 44,310 | 56.0% |
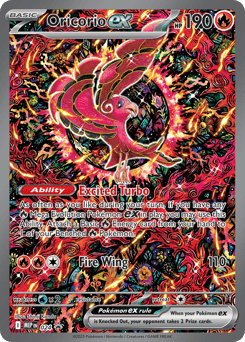 Oricorio exMega Evolution Black Star Promos · 2025 | 65,478 | 34,820 | 53.2% |
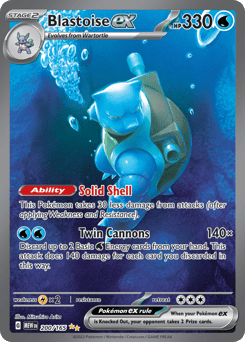 Blastoise ex151 · 2023 | 64,464 | 19,073 | 29.6% |
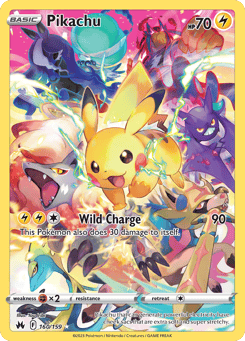 PikachuCrown Zenith · 2023 | 63,361 | 33,459 | 52.8% |
Do 1st Edition Pokémon cards grade PSA 10 more often than Unlimited?· the same 233 cards, each printing with 1,000+ graded
On the same cards, 1st Edition copies grade 10 more often than Unlimited.
| Card | Unlimited graded | Unlimited rate | 1st Ed. graded | 1st Ed. rate |
|---|---|---|---|---|
| All 233 cards | 1,260,598 | 4.4% | 743,804 | 10.2% |
| CharizardBase Set · #4 | 105,414 | 0.5% | 5,425 | 2.3% |
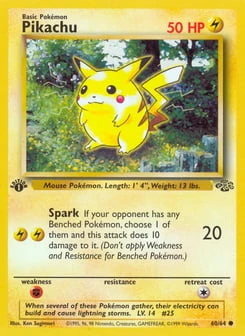 PikachuJungle · #60 | 12,049 | 11.9% | 18,933 | 17.5% |
| Dark CharizardTeam Rocket · #4 | 19,861 | 0.9% | 12,010 | 4.6% |
| 4,809 | 16.8% | 10,008 | 18.5% | |
| 1,941 | 9.1% | 9,922 | 20.7% | |
| 9,900 | 2.5% | 9,074 | 7.8% | |
| Dark BlastoiseTeam Rocket · #3 | 11,706 | 0.6% | 9,032 | 2.5% |
| 9,964 | 0.5% | 8,991 | 2.5% | |
| 17,326 | 0.4% | 8,691 | 2.7% | |
| 1,448 | 7.8% | 8,214 | 20.4% | |
| 7,632 | 0.4% | 7,942 | 3.1% |
Read with care: the two printings have separate populations
1st Edition and Unlimited are separate PSA specs, so each printing carries its own population.
The comparison is of the slabs that exist for each, not of print quality alone.
Does PSA or CGC give more 10s on the same Pokémon cards?· cards with 100+ copies graded by each, CGC counts of 16 Oct 2026
On 5,721 shared cards PSA's 10 rate is 36.6% and CGC's is 33.8%.
| Era | Cards | PSA graded | PSA 10 rate | CGC graded | CGC 10 rate |
|---|---|---|---|---|---|
| All eras | 5,721 | 15,264,078 | 36.6% | 4,193,338 | 33.8% |
| Wizards of the Coast | 998 | 1,930,761 | 7.6% | 744,998 | 9.7% |
| EX | 515 | 412,993 | 7.0% | 118,057 | 14.8% |
| Diamond & Pearl | 111 | 59,978 | 3.6% | 19,216 | 3.6% |
| Platinum | 68 | 48,240 | 3.6% | 12,063 | 2.3% |
| HeartGold & SoulSilver | 82 | 81,521 | 3.5% | 16,644 | 3.2% |
| Black & White | 90 | 93,490 | 4.5% | 21,838 | 4.5% |
| XY | 346 | 850,016 | 17.4% | 165,608 | 7.2% |
| Sun & Moon | 600 | 1,608,283 | 43.2% | 314,317 | 26.1% |
| Sword & Shield | 1,400 | 4,005,544 | 50.9% | 1,147,421 | 39.1% |
| Scarlet & Violet | 1,237 | 4,573,599 | 34.7% | 1,247,579 | 41.8% |
| Mega Evolution | 274 | 1,599,653 | 58.4% | 385,597 | 68.3% |
Read with care: different submissions, not different strictness
The two graders see different submissions, so this compares the slabs that exist at each, not how strictly each one grades.
PSA 10 rate for every English Pokémon set· 183 sets in release order · ranked sets have 10,000+ graded
All 183 sets, oldest first; a high Top 2 share means the rate mostly describes two cards.
What the Top 2 share column means
A set's gem rate counts every card in it with a PSA count.
Top 2 share is how much of the set's graded population sits in its two most-graded cards.
| Set | Released | Cards | Graded | PSA 10 | Gem rate | Top 2 share |
|---|---|---|---|---|---|---|
 Base Set | 1999-01-09 | 100 | 636,005 | 46,179 | 7.3% | 24.8% |
 Jungle | 1999-06-16 | 63 | 156,273 | 7,556 | 4.8% | 18.5% |
 Wizards Black Star Promos | 1999-07-01 | 47 | 163,882 | 35,489 | 21.7% | 17.8% |
| Fossil | 1999-10-10 | 62 | 168,202 | 6,600 | 3.9% | 19.0% |
 Base Set 2 | 2000-02-24 | 129 | 140,772 | 7,426 | 5.3% | 26.1% |
| Team Rocket | 2000-04-24 | 83 | 135,620 | 3,987 | 2.9% | 23.3% |
| Gym Heroes | 2000-08-14 | 132 | 77,045 | 2,882 | 3.7% | 22.3% |
 Gym Challenge | 2000-10-16 | 132 | 80,402 | 4,784 | 5.9% | 19.4% |
| Neo Genesis | 2000-12-16 | 111 | 62,544 | 1,950 | 3.1% | 27.0% |
 Neo Discovery | 2001-06-01 | 75 | 43,062 | 1,959 | 4.5% | 29.5% |
 Southern Islands | 2001-07-31 | 18 | 30,831 | 3,447 | 11.2% | 27.5% |
| Neo Revelation | 2001-09-21 | 65 | 46,743 | 1,893 | 4.0% | 33.6% |
 Neo Destiny | 2002-02-28 | 111 | 69,604 | 5,022 | 7.2% | 18.8% |
 Legendary Collection | 2002-05-24 | 110 | 31,212 | 4,305 | 13.8% | 15.0% |
 Expedition Base Set | 2002-09-15 | 165 | 72,623 | 10,730 | 14.8% | 8.6% |
 Best of Game | 2002-12-01 | 9 | 5,682 | 1,089 | 19.2% | 40.3% |
 Aquapolis | 2003-01-15 | 181 | 49,684 | 7,659 | 15.4% | 11.8% |
 Skyridge | 2003-05-12 | 182 | 57,790 | 13,552 | 23.4% | 5.9% |
 Ruby & Sapphire | 2003-07-01 | 107 | 27,213 | 1,744 | 6.4% | 24.0% |
 Sandstorm | 2003-09-18 | 100 | 22,822 | 2,365 | 10.4% | 18.7% |
 Nintendo Black Star Promos | 2003-10-01 | 37 | 25,327 | 1,292 | 5.1% | 33.4% |
 Dragon | 2003-11-24 | 100 | 32,406 | 3,015 | 9.3% | 20.4% |
 Team Magma vs Team Aqua | 2004-03-15 | 97 | 16,429 | 1,594 | 9.7% | 15.3% |
 Hidden Legends | 2004-06-01 | 102 | 17,370 | 2,497 | 14.4% | 17.1% |
 EX Trainer Kit Latias | 2004-06-01 | 9 | 644 | 30 | 4.7% | 96.9% |
 EX Trainer Kit Latios | 2004-06-01 | 8 | 797 | 67 | 8.4% | 99.0% |
 Poké Card Creator Pack | 2004-07-01 | 5 | 1,601 | 102 | 6.4% | 42.7% |
 FireRed & LeafGreen | 2004-09-01 | 114 | 32,268 | 4,291 | 13.3% | 22.4% |
 POP Series 1 | 2004-09-01 | 17 | 3,869 | 160 | 4.1% | 64.3% |
 Team Rocket Returns | 2004-11-01 | 110 | 30,726 | 3,829 | 12.5% | 10.3% |
 Deoxys | 2005-02-01 | 108 | 19,005 | 1,414 | 7.4% | 20.7% |
 Emerald | 2005-05-01 | 107 | 14,474 | 1,366 | 9.4% | 15.2% |
 Unseen Forces | 2005-08-01 | 144 | 38,106 | 3,253 | 8.5% | 21.6% |
 POP Series 2 | 2005-08-01 | 17 | 3,367 | 461 | 13.7% | 67.3% |
 Delta Species | 2005-10-31 | 114 | 32,639 | 3,132 | 9.6% | 10.8% |
 Legend Maker | 2006-02-01 | 93 | 20,351 | 1,760 | 8.6% | 18.9% |
 EX Trainer Kit 2 Plusle | 2006-03-01 | 8 | 183 | 10 | 5.5% | 94.0% |
 EX Trainer Kit 2 Minun | 2006-03-01 | 9 | 277 | 29 | 10.5% | 72.9% |
 POP Series 3 | 2006-04-01 | 17 | 5,747 | 385 | 6.7% | 35.2% |
 Holon Phantoms | 2006-05-01 | 111 | 29,274 | 2,332 | 8.0% | 17.6% |
 Crystal Guardians | 2006-08-01 | 99 | 29,686 | 2,072 | 7.0% | 29.8% |
 POP Series 4 | 2006-08-01 | 17 | 3,409 | 215 | 6.3% | 45.4% |
 Dragon Frontiers | 2006-11-01 | 101 | 30,627 | 1,593 | 5.2% | 29.6% |
 Power Keepers | 2007-02-02 | 108 | 26,938 | 2,039 | 7.6% | 23.2% |
 POP Series 5 | 2007-03-01 | 17 | 5,556 | 241 | 4.3% | 38.5% |
 Diamond & Pearl | 2007-05-01 | 123 | 6,926 | 275 | 4.0% | 27.2% |
| DP Black Star Promos | 2007-05-01 | 51 | 21,417 | 203 | 0.9% | 25.8% |
 Mysterious Treasures | 2007-08-01 | 123 | 8,353 | 336 | 4.0% | 17.2% |
 POP Series 6 | 2007-09-01 | 17 | 776 | 26 | 3.4% | 44.1% |
| Secret Wonders | 2007-11-01 | 130 | 12,404 | 405 | 3.3% | 31.3% |
 Great Encounters | 2008-02-01 | 106 | 6,552 | 882 | 13.5% | 32.8% |
 POP Series 7 | 2008-03-01 | 17 | 924 | 18 | 1.9% | 49.8% |
 Majestic Dawn | 2008-05-01 | 100 | 7,275 | 380 | 5.2% | 20.4% |
 Legends Awakened | 2008-08-01 | 145 | 6,613 | 239 | 3.6% | 21.9% |
 POP Series 8 | 2008-09-01 | 17 | 533 | 29 | 5.4% | 34.3% |
| Stormfront | 2008-11-01 | 105 | 11,388 | 448 | 3.9% | 36.4% |
 Platinum | 2009-02-11 | 130 | 9,915 | 396 | 4.0% | 21.0% |
 POP Series 9 | 2009-03-01 | 17 | 944 | 52 | 5.5% | 49.1% |
 Rising Rivals | 2009-05-16 | 104 | 9,102 | 385 | 4.2% | 19.6% |
 Supreme Victors | 2009-08-19 | 153 | 20,781 | 915 | 4.4% | 23.4% |
 Arceus | 2009-11-04 | 110 | 18,985 | 853 | 4.5% | 26.3% |
 Pokémon Rumble | 2009-12-02 | 16 | 8,082 | 239 | 3.0% | 21.0% |
| HeartGold & SoulSilver | 2010-02-10 | 123 | 15,276 | 449 | 2.9% | 19.4% |
 HGSS Black Star Promos | 2010-02-10 | 24 | 8,274 | 117 | 1.4% | 33.8% |
| HS—Unleashed | 2010-05-12 | 96 | 10,994 | 402 | 3.7% | 19.4% |
| HS—Undaunted | 2010-08-18 | 91 | 20,972 | 569 | 2.7% | 42.7% |
 HS—Triumphant | 2010-11-03 | 103 | 23,838 | 1,807 | 7.6% | 26.9% |
| Call of Legends | 2011-02-09 | 106 | 21,219 | 859 | 4.0% | 14.2% |
| BW Black Star Promos | 2011-03-01 | 97 | 22,345 | 442 | 2.0% | 23.0% |
 Black & White | 2011-04-25 | 110 | 10,315 | 982 | 9.5% | 56.4% |
 McDonald's Collection 2011 | 2011-06-17 | 12 | 264 | 23 | 8.7% | 26.5% |
 Emerging Powers | 2011-08-31 | 90 | 2,188 | 271 | 12.4% | 68.9% |
 Noble Victories | 2011-11-16 | 81 | 3,944 | 448 | 11.4% | 43.0% |
 Next Destinies | 2012-02-08 | 99 | 6,288 | 349 | 5.5% | 22.0% |
 Dark Explorers | 2012-05-09 | 87 | 5,328 | 307 | 5.8% | 22.0% |
 McDonald's Collection 2012 | 2012-06-15 | 12 | 181 | 11 | 6.1% | 24.3% |
 Dragons Exalted | 2012-08-15 | 128 | 11,789 | 1,225 | 10.4% | 34.1% |
 Dragon Vault | 2012-10-05 | 21 | 3,776 | 249 | 6.6% | 31.7% |
 Boundaries Crossed | 2012-11-07 | 119 | 10,071 | 1,234 | 12.3% | 17.5% |
 Plasma Storm | 2013-02-06 | 127 | 13,940 | 869 | 6.2% | 37.1% |
 Plasma Freeze | 2013-05-08 | 112 | 11,074 | 603 | 5.5% | 18.3% |
 Plasma Blast | 2013-08-14 | 95 | 8,064 | 521 | 6.5% | 24.5% |
 XY Black Star Promos | 2013-10-12 | 214 | 133,394 | 6,916 | 5.2% | 16.2% |
| Legendary Treasures | 2013-11-06 | 139 | 42,277 | 1,531 | 3.6% | 36.3% |
 Kalos Starter Set | 2013-11-08 | 11 | 85 | 1 | 1.2% | 69.4% |
 XY | 2014-02-05 | 134 | 7,638 | 781 | 10.2% | 32.9% |
 Flashfire | 2014-05-07 | 109 | 30,420 | 4,551 | 15.0% | 41.0% |
 McDonald's Collection 2014 | 2014-05-23 | 12 | 187 | 2 | 1.1% | 58.3% |
 Furious Fists | 2014-08-13 | 98 | 7,760 | 562 | 7.2% | 26.6% |
 Phantom Forces | 2014-11-05 | 103 | 28,017 | 5,515 | 19.7% | 61.7% |
 Primal Clash | 2015-02-04 | 164 | 16,555 | 851 | 5.1% | 17.1% |
| Double Crisis | 2015-03-25 | 34 | 12,745 | 41 | 0.3% | 97.0% |
 Roaring Skies | 2015-05-06 | 110 | 28,253 | 2,611 | 9.2% | 27.9% |
 Ancient Origins | 2015-08-12 | 100 | 40,633 | 7,893 | 19.4% | 23.7% |
 BREAKthrough | 2015-11-04 | 148 | 36,651 | 5,289 | 14.4% | 20.9% |
 McDonald's Collection 2015 | 2015-11-27 | 12 | 231 | 1 | 0.4% | 51.9% |
 BREAKpoint | 2016-02-03 | 118 | 40,863 | 7,931 | 19.4% | 33.7% |
 Generations | 2016-02-22 | 113 | 91,416 | 4,792 | 5.2% | 24.5% |
 Fates Collide | 2016-05-02 | 127 | 43,599 | 7,716 | 17.7% | 31.9% |
 Steam Siege | 2016-08-03 | 115 | 28,300 | 8,716 | 30.8% | 28.4% |
 McDonald's Collection 2016 | 2016-08-19 | 3 | 29 | 1 | 3.5% | 72.4% |
 Evolutions | 2016-11-02 | 113 | 366,746 | 91,604 | 25.0% | 23.8% |
 Sun & Moon | 2017-02-03 | 162 | 46,970 | 13,952 | 29.7% | 26.1% |
 SM Black Star Promos | 2017-02-03 | 249 | 441,401 | 148,475 | 33.6% | 27.5% |
 Guardians Rising | 2017-05-05 | 179 | 24,778 | 10,510 | 42.4% | 22.8% |
 Burning Shadows | 2017-08-05 | 175 | 39,573 | 7,856 | 19.9% | 34.8% |
 Shining Legends | 2017-10-06 | 80 | 89,394 | 27,019 | 30.2% | 33.1% |
 Crimson Invasion | 2017-11-03 | 125 | 17,420 | 5,950 | 34.2% | 22.4% |
 McDonald's Collection 2017 | 2017-11-07 | 12 | 210 | 11 | 5.2% | 58.6% |
 Ultra Prism | 2018-02-02 | 174 | 29,904 | 11,899 | 39.8% | 20.9% |
 Forbidden Light | 2018-05-04 | 149 | 14,581 | 6,698 | 45.9% | 11.1% |
 Celestial Storm | 2018-08-03 | 171 | 36,149 | 17,995 | 49.8% | 55.2% |
 Dragon Majesty | 2018-09-07 | 79 | 15,836 | 6,975 | 44.0% | 33.9% |
 McDonald's Collection 2018 | 2018-10-16 | 12 | 575 | 14 | 2.4% | 47.8% |
 Lost Thunder | 2018-11-02 | 196 | 25,596 | 8,084 | 31.6% | 17.8% |
 Team Up | 2019-02-01 | 196 | 85,540 | 35,289 | 41.3% | 22.7% |
 Detective Pikachu | 2019-04-05 | 18 | 18,312 | 4,969 | 27.1% | 34.1% |
 Unbroken Bonds | 2019-05-03 | 221 | 98,598 | 47,533 | 48.2% | 27.4% |
 Unified Minds | 2019-08-02 | 238 | 91,209 | 37,133 | 40.7% | 15.0% |
| Hidden Fates | 2019-08-23 | 69 | 152,790 | 90,597 | 59.3% | 35.6% |
| Hidden Fates Shiny Vault | 2019-08-23 | 94 | 324,668 | 193,444 | 59.6% | 10.5% |
 McDonald's Collection 2019 | 2019-10-15 | 12 | 577 | 37 | 6.4% | 40.7% |
 Cosmic Eclipse | 2019-11-01 | 266 | 174,227 | 66,178 | 38.0% | 16.9% |
 SWSH Black Star Promos | 2019-11-15 | 243 | 701,588 | 208,293 | 29.7% | 21.7% |
| Sword & Shield | 2020-02-07 | 212 | 60,025 | 40,156 | 66.9% | 27.3% |
| Rebel Clash | 2020-05-01 | 198 | 27,759 | 18,404 | 66.3% | 14.5% |
| Darkness Ablaze | 2020-08-14 | 201 | 100,211 | 70,057 | 69.9% | 43.8% |
 Pokémon Futsal Collection | 2020-09-11 | 5 | 19,844 | 6,166 | 31.1% | 55.7% |
| Champion's Path | 2020-09-25 | 79 | 107,419 | 70,487 | 65.6% | 55.4% |
 Vivid Voltage | 2020-11-13 | 201 | 202,888 | 118,102 | 58.2% | 21.5% |
 McDonald's Collection 2021 | 2021-02-09 | 25 | 31,509 | 11,349 | 36.0% | 36.4% |
 Shining Fates | 2021-02-19 | 73 | 39,822 | 22,713 | 57.0% | 37.9% |
| Shining Fates Shiny Vault | 2021-02-19 | 122 | 87,142 | 60,749 | 69.7% | 59.8% |
 Battle Styles | 2021-03-19 | 176 | 49,647 | 27,698 | 55.8% | 39.9% |
| Chilling Reign | 2021-06-18 | 222 | 111,513 | 68,167 | 61.1% | 21.3% |
| Evolving Skies | 2021-08-27 | 231 | 345,757 | 205,893 | 59.6% | 15.6% |
 Celebrations | 2021-10-08 | 25 | 178,979 | 52,240 | 29.2% | 45.8% |
| Celebrations: Classic Collection | 2021-10-08 | 25 | 282,427 | 167,544 | 59.3% | 38.9% |
 Fusion Strike | 2021-11-12 | 270 | 168,687 | 88,076 | 52.2% | 29.3% |
 Brilliant Stars | 2022-02-25 | 180 | 145,112 | 75,290 | 51.9% | 39.7% |
 Brilliant Stars Trainer Gallery | 2022-02-25 | 30 | 133,166 | 66,638 | 50.0% | 26.9% |
 Astral Radiance | 2022-05-27 | 203 | 80,043 | 42,830 | 53.5% | 27.8% |
 Astral Radiance Trainer Gallery | 2022-05-27 | 30 | 57,097 | 28,125 | 49.3% | 53.2% |
 Pokémon GO | 2022-07-01 | 88 | 102,044 | 49,788 | 48.8% | 38.3% |
 McDonald's Collection 2022 | 2022-08-03 | 15 | 1,167 | 110 | 9.4% | 66.5% |
 Lost Origin | 2022-09-09 | 208 | 81,285 | 36,892 | 45.4% | 44.7% |
 Lost Origin Trainer Gallery | 2022-09-09 | 30 | 149,165 | 60,615 | 40.6% | 29.3% |
 Silver Tempest | 2022-11-11 | 206 | 140,034 | 75,860 | 54.2% | 41.6% |
| Silver Tempest Trainer Gallery | 2022-11-11 | 30 | 94,652 | 59,654 | 63.0% | 40.5% |
 Scarlet & Violet Black Star Promos | 2023-01-01 | 214 | 904,370 | 316,231 | 35.0% | 22.6% |
 Crown Zenith | 2023-01-20 | 159 | 139,643 | 74,711 | 53.5% | 68.2% |
 Crown Zenith Galarian Gallery | 2023-01-20 | 70 | 578,628 | 303,201 | 52.4% | 16.1% |
 Scarlet & Violet | 2023-03-31 | 241 | 173,759 | 48,008 | 27.6% | 20.5% |
 Paldea Evolved | 2023-06-09 | 279 | 184,827 | 55,549 | 30.0% | 22.5% |
 Obsidian Flames | 2023-08-11 | 189 | 242,360 | 60,129 | 24.8% | 38.5% |
 McDonald's Collection 2023 | 2023-09-11 | 15 | 1,671 | 151 | 9.0% | 76.1% |
 151 | 2023-09-22 | 207 | 814,118 | 230,304 | 28.3% | 20.9% |
 Paradox Rift | 2023-11-03 | 255 | 148,229 | 52,111 | 35.2% | 20.2% |
 Pokémon TCG Classic - Blastoise | 2023-11-16 | 32 | 20,942 | 9,745 | 46.5% | 38.8% |
 Pokémon TCG Classic - Charizard | 2023-11-16 | 32 | 21,920 | 10,731 | 49.0% | 49.3% |
 Pokémon TCG Classic - Venusaur | 2023-11-16 | 31 | 17,086 | 8,495 | 49.7% | 46.5% |
 Paldean Fates | 2024-01-26 | 242 | 213,508 | 83,660 | 39.2% | 43.4% |
 Temporal Forces | 2024-03-22 | 217 | 143,066 | 58,659 | 41.0% | 20.2% |
 Twilight Masquerade | 2024-05-24 | 205 | 175,044 | 76,236 | 43.5% | 30.8% |
 Shrouded Fable | 2024-08-02 | 93 | 65,821 | 25,073 | 38.1% | 28.8% |
 Stellar Crown | 2024-09-13 | 135 | 152,942 | 59,501 | 38.9% | 47.8% |
 Surging Sparks | 2024-11-08 | 250 | 320,696 | 112,012 | 34.9% | 18.6% |
 Prismatic Evolutions | 2025-01-17 | 176 | 253,975 | 80,593 | 31.7% | 15.0% |
 McDonald's Collection 2024 | 2025-01-21 | 14 | 11,811 | 1,945 | 16.5% | 48.9% |
 Journey Together | 2025-03-28 | 156 | 220,300 | 68,320 | 31.0% | 23.8% |
 Destined Rivals | 2025-05-30 | 218 | 378,664 | 169,092 | 44.6% | 16.0% |
 White Flare | 2025-07-18 | 139 | 97,244 | 39,637 | 40.8% | 22.9% |
 Black Bolt | 2025-07-18 | 129 | 116,931 | 51,287 | 43.9% | 22.4% |
 Mega Evolution | 2025-09-26 | 152 | 372,793 | 208,399 | 55.9% | 13.1% |
 Mega Evolution Energies | 2025-09-26 | 7 | 14 | 0 | – | 42.9% |
| Mega Evolution Black Star Promos | 2025-09-26 | 60 | 495,606 | 293,812 | 59.3% | 38.5% |
 Phantasmal Flames | 2025-11-14 | 111 | 325,272 | 170,674 | 52.5% | 29.6% |
| Ascended Heroes | 2026-01-30 | 251 | 323,823 | 206,537 | 63.8% | 16.2% |
| Perfect Order | 2026-03-27 | 111 | 80,836 | 53,505 | 66.2% | 33.0% |
| Chaos Rising | 2026-05-22 | 81 | 33,381 | 20,982 | 62.9% | 34.9% |
 Pitch Black | 2026-07-17 | 24 | 1,802 | 992 | 55.0% | 68.7% |
 30th Celebration | 2026-09-16 | 11 | 238 | 196 | 82.3% | 51.3% |
 30th Celebration: Classic Collection | 2026-09-16 | 8 | 154 | 136 | 88.3% | 83.8% |
Chart: PSA 10 gem rate by set
For media
Free to cite · CC-BY 4.0- Updated
- RefreshesMonthly; each edition is kept at its own URL
- SourcePSA population counts from GemRate and PSA's population report, and CGC population counts, joined to CardTrack's English catalogue.
Source: CardTrack, PSA 10 gem rate by set, October 2026, 17 October 2026. https://cardtrack.com/data/psa-10-rate-by-set/2026-10Charts and tables may be reproduced with the attribution above under CC-BY 4.0. How the numbers are built: methodology. Press enquiries, corrections and custom cuts of the data: jd@cardtrack.com. CardTrack is a market measure, not investment advice.
Frequently asked questions: PSA 10 gem rate by set
What percentage of Pokémon cards get a PSA 10?
36.1% of the 16,074,760 English Pokémon cards PSA has graded are PSA 10s (PSA population data to 13 Oct 2026). The rate ranges by era from 3.9% (Diamond & Pearl) to 58.5% (Mega Evolution).
Which Pokémon set is hardest to get a PSA 10 from?
Of sets with 10,000+ graded copies, Double Crisis has the lowest gem rate at 0.3%, followed by DP Black Star Promos (0.9%) and BW Black Star Promos (2.0%).
Does PSA or CGC give more 10s on Pokémon cards?
On 5,721 English cards graded 100+ times by both, PSA's 10 rate is 36.6% and CGC's 33.8% (counts of 16 Oct 2026). The graders see different submissions, so this compares the slabs that exist, not strictness.
Which card is hardest to grade a PSA 10?
Among cards with 10,000+ graded copies, the Neo Genesis Lugia (Unlimited): 15 PSA 10s from 12,549 graded, 1 in 837.
Method: how CardTrack built these figures
How the figures are built: what is counted, where the prices come from, thresholds and caveats
What is counted
- Every English Pokémon card in CardTrack's catalogue with a PSA population count, at the main printing as PSA lists it (the Unlimited copy for a Wizards card with a 1st Edition).
- 1st Edition and Shadowless are their own PSA specs and are compared separately.
- The gem rate is PSA 10s over PSA's total for the card, summed over cards. A card needs 20+ graded copies to carry a rate of its own.
Sources and dates
- PSA counts from GemRate as of 13 Oct 2026 for 17,411 cards.
- PSA's population report of 28 Sep 2026 for 2,118 more.
- CGC counts as of 16 Oct 2026.
Thresholds
- Set rankings: 10,000+ graded copies in the set (136 sets). Every set is in the full table and the CSV.
- Hardest cards: 10,000+ graded; modern (Sword & Shield, Scarlet & Violet, Mega Evolution): 5,000+.
- 1st Edition against Unlimited: both printings with 1,000+ graded. PSA against CGC: 100+ with each.
How to read it
- A gem rate describes the slabs that exist, not the probability that a given raw copy will grade 10.
- Owners send in the copies they expect to grade well, and modern cards are often graded straight from the pack, so a high rate is partly selection.
Edition
October 2026 edition, published 17 Oct 2026. Figures are frozen; the live population report and gem-rate pages move as PSA's counts do.
Editions of the PSA 10 gem rate by set study
- October 2026
Each edition keeps its own page, CSV and chart at /data/psa-10-rate-by-set/<edition>, so a citation of one month's figures keeps pointing at them.